CDP Cloud Data Platform · User Manual
Temperature Monitoring Cloud Platform for Mass Concrete — a step-by-step guide from device onboarding, data viewing and report customization to data forwarding, alarm push and API integration.
01Platform Overview
The CDP Cloud Data Platform (cdp.0531hyt.com) is an independently developed cloud management platform for mass concrete temperature monitoring. It unifies two types of field devices — TG temperature collectors and DG data gateways — and collects measurement data in real time over UDP / MQTT protocols, providing cloud storage, intelligent analysis, multi-dimensional visualization, alarm push and third-party data forwarding.
Built on a four-layer architecture (device → collection → application → data) with FastAPI + PostgreSQL 16 (multi-schema), the platform features a responsive UI supporting both PC desktop view and Field Mode (/m/), and is fully available in Chinese and English.
Capability Overview
| Capability | Description | Entry |
|---|---|---|
| Dashboard | Device totals / online rate / temperature range / alarm summary, temperature trend chart | /dashboard |
| Device Management | TG / DG device lists, search, sub-devices and measurement/control support | /devices/tg /devices/dg |
| Data Viewing | TG real-time data, DG data status, history and temperature curves | /data/tg /data/dg |
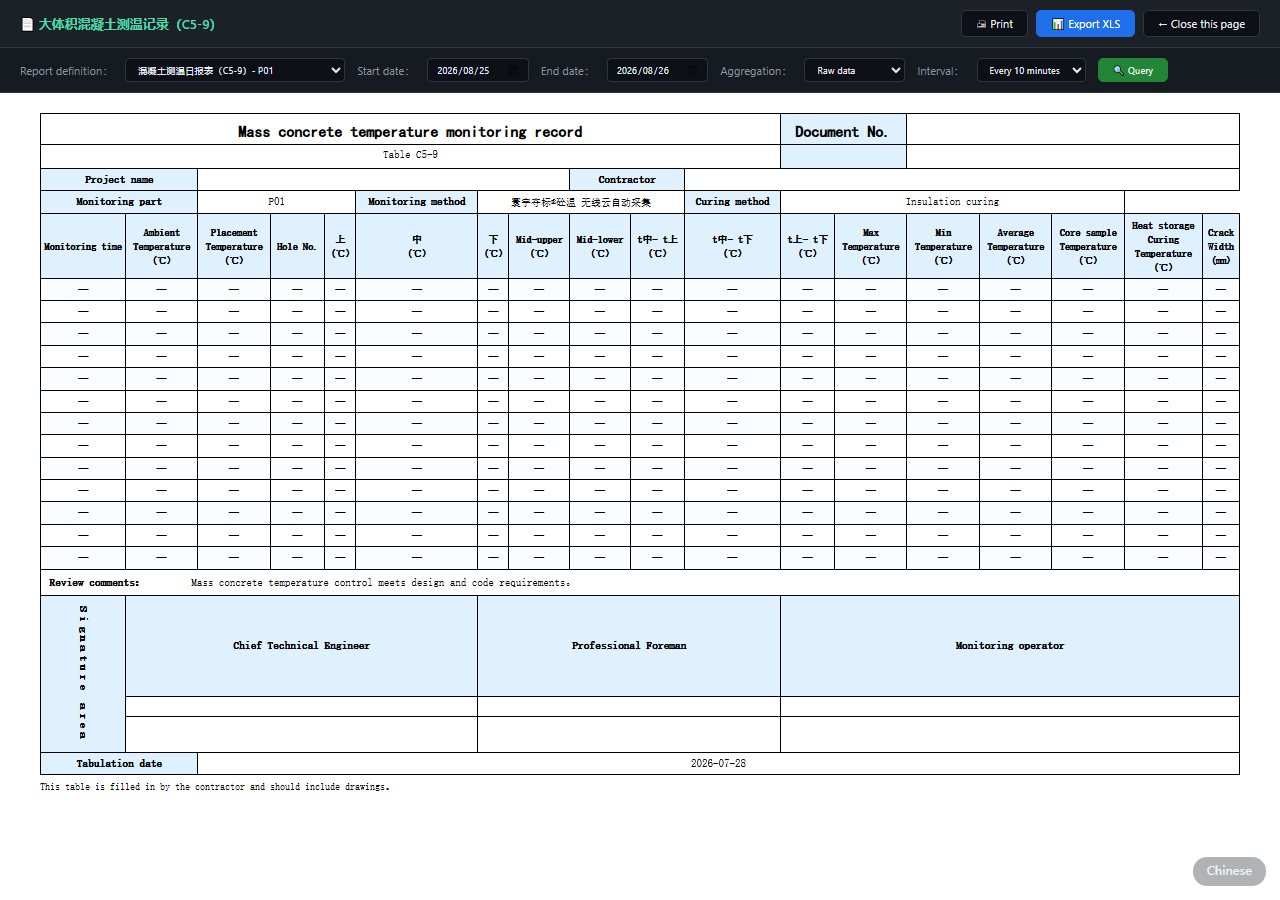
| Custom Data System | Data groups, real-time/history chart customization, C5-9 reports, chart headers | /custom-data |
| Visualization | Section cloud maps, 3D component models, SCADA monitoring panels | /section-cloud /3d |
| Data Forwarding & Push | Forward TG/DG data to third-party endpoints with logs | /toolbox/tg-push |
| Alarm Rules & Push | Temperature threshold alarms with email / MQTT / SMS channels | /custom-data |
| User API | REST endpoints: device lists, real-time values, alarm rules, SIM status | /toolbox/api-docs |
| Field Mode (Mobile) | Mobile entry: device list, device claiming, data viewing | /m/ /m/devices |
demo / demo is available for evaluation; use the account assigned by the administrator in production.02Quick Start
From sign-up to viewing device data — five simple steps.
Detailed Flow
- Register: visit
cdp.0531hyt.com/register, fill in username, password and contact details. - Log in: visit
cdp.0531hyt.com/login; switch language from the top-right corner (中文 / English). - Claim devices: search by SN in the device list and click Claim to take ownership (mobile:
/m/claimby scanning or entering SN). - View data: open
/data/tg(TG temperatures) or/data/dg(DG status) for real-time values and curves. - Enable advanced features: configure data forwarding (
/toolbox/tg-push), alarm rules (/custom-data), or integrate via the User API (/toolbox/api-docs).
03Account & Login
Login
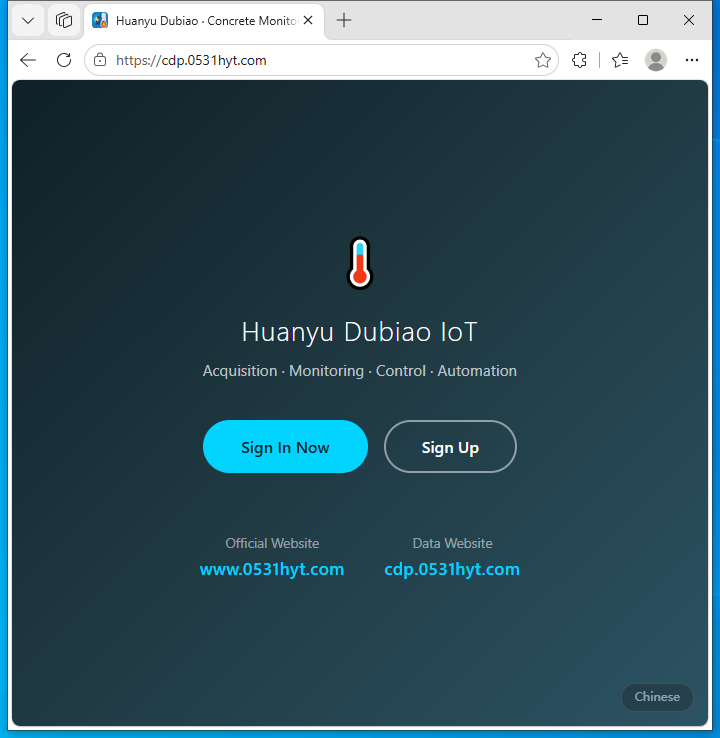
Open /login and enter your username and password. The platform uses JWT token authentication; tokens are valid for 8 hours. After closing the browser you will need to log in again.
- Browsers can remember your username for convenience.
- Forgot password: click the link on the login page to reset via your registered phone / email.
- No account yet: click Register to create one at
/register.
Profile
After login, visit /my-profile to view / edit your nickname, contact info, company and password, and to manage your data viewer configuration (/my-profile/viewer).
Permission Model
| Role | Description | Main Capabilities |
|---|---|---|
| Regular User | Default role after registration | Claim devices, view own device data, configure charts/reports/alarms/forwarding, call APIs |
| Viewer (read-only) | Read-only account assigned by admin | View data only; cannot modify configs or claim devices |
| Administrator | Platform operator | User management, full device overview, sub-device config, ownership audit (/admin) |
04Dashboard
After login you land on the dashboard (/dashboard) — the platform "cockpit" showing device status, temperature data and alarm overview at a glance.
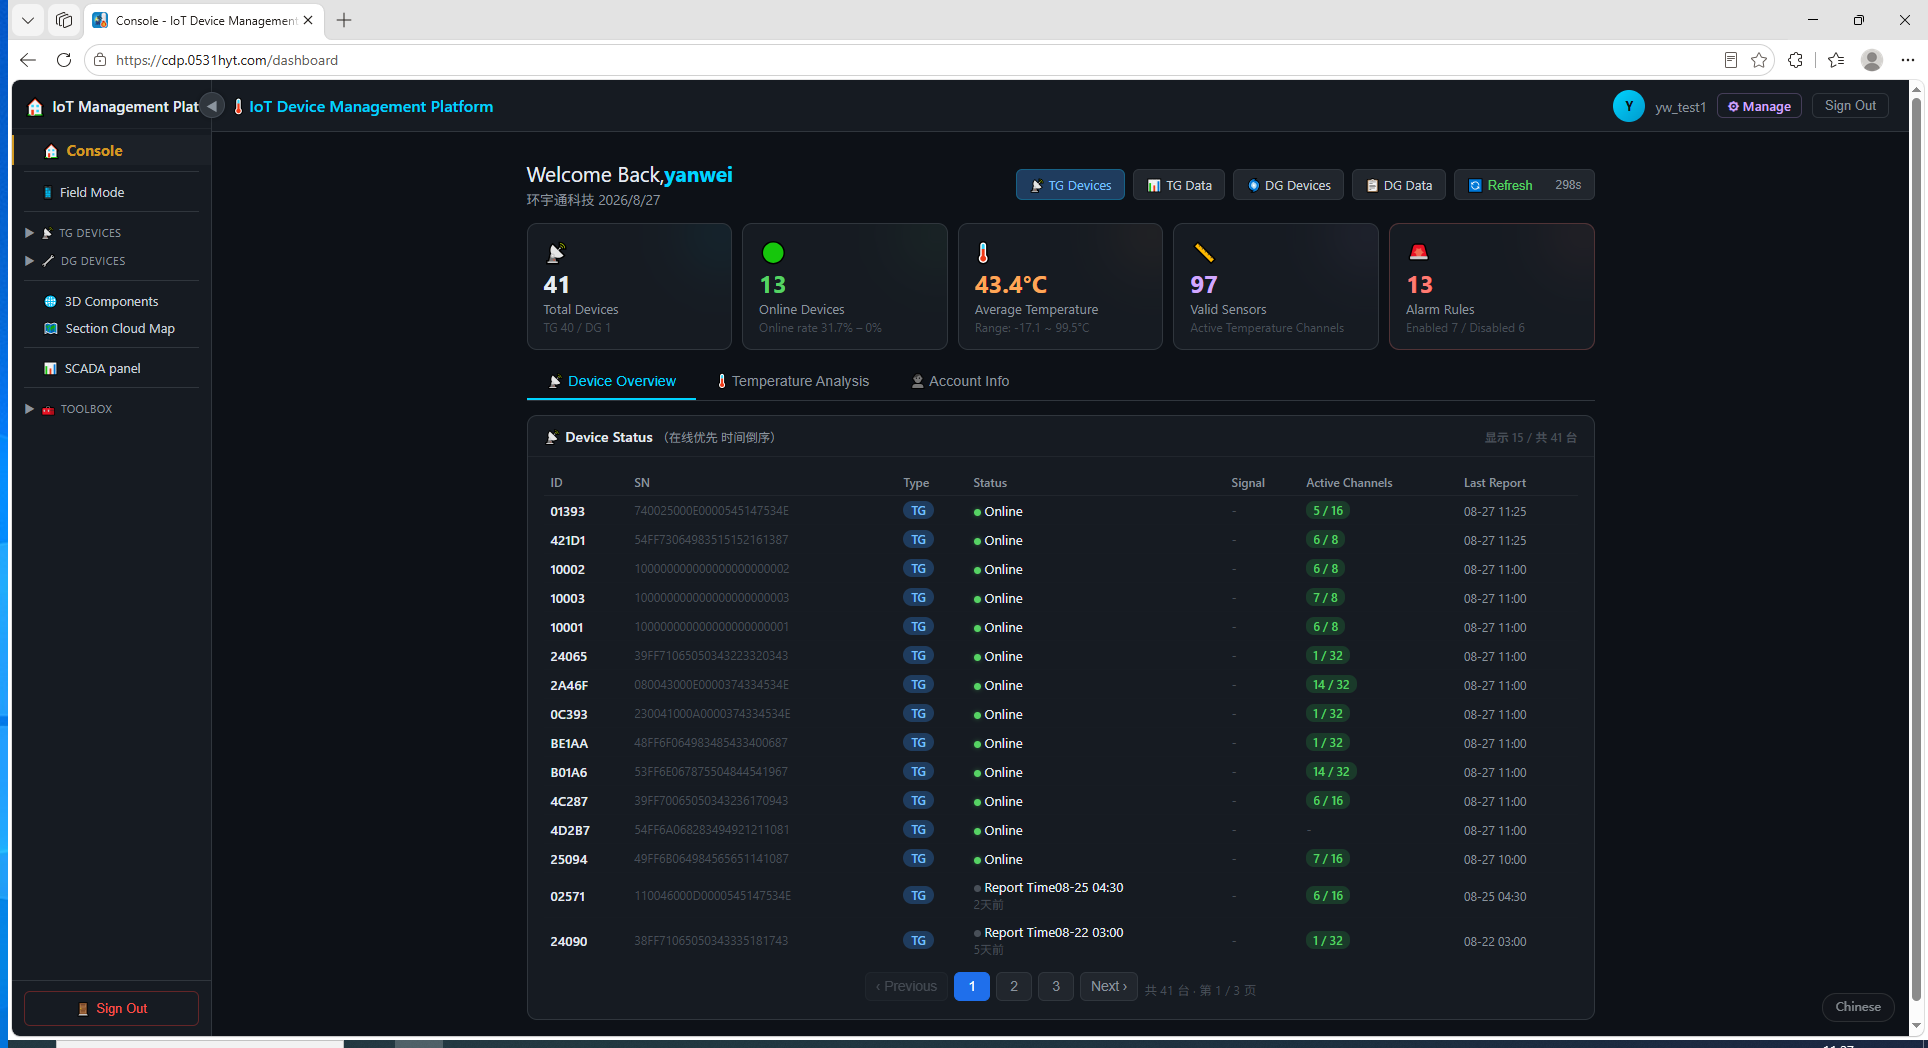
Stat Cards (top)
| Stat | Description |
|---|---|
| Device totals | TG count / DG count, e.g. "TG 40 / DG 1" |
| Online rate | Share of devices currently online, e.g. "Online rate 31.7%" |
| Temperature range | Current global max/min, e.g. "Range: 17.1 ~ 84.8 °C" |
| Alarm overview | Enabled / disabled alarm rules, e.g. "Enabled 7 / Disabled 6" |
| Active channels | Temperature channels currently reporting |
| No alarm rules | Shown when no alarm rule is configured |
Quick Access
Below the stat cards, TG Data / DG Data buttons jump directly to the corresponding pages; the device list supports searching by SN / TGID / nickname.
Temperature Analysis
Switch to the Temperature Analysis tab to view trend curves (Chart.js) with Max / Average / Min legends and a "Based on N devices" footer; use it to quickly spot abnormal temperature rises.
Device List
The bottom of the dashboard lists recently reporting devices with online status, report time and temperature summary; click a device to open its data page.
05Device Management
Device management is split into TG devices (temperature collectors) and DG devices (data gateways). Both support keyword search and pagination.
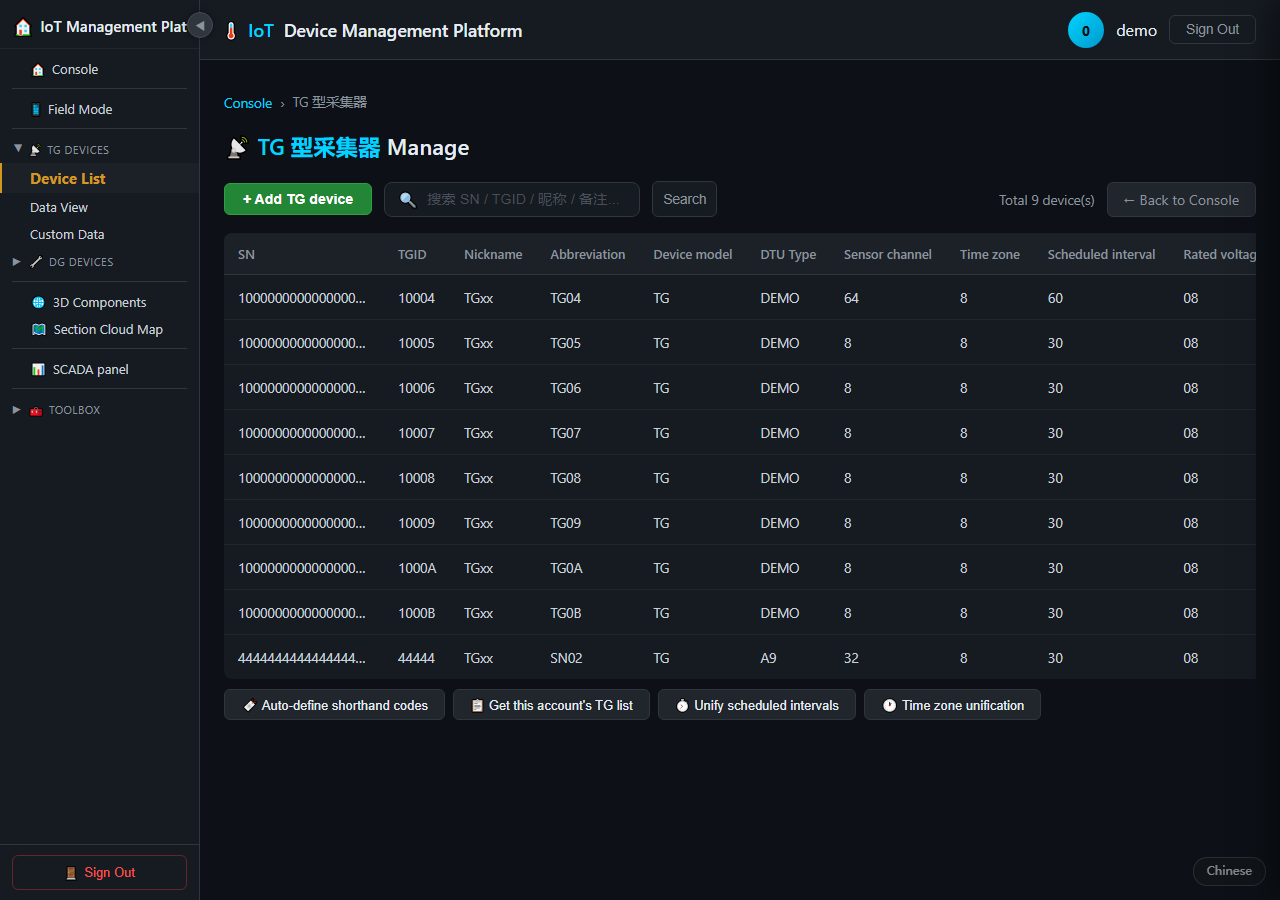
TG Devices (/devices/tg)
- Keyword search: fuzzy search by SN, TGID or nickname.
- Device cards: nickname, SN, TGID, online status, current temperature, channel count, last report time.
- Claim / ownership: unclaimed devices show a Claim button; claimed devices are visible only to their owner and admins.
- Pagination: "Total N entries, page X-Y" with paging controls.
DG Devices (/devices/dg)
The DG gateway list shows DTU type, SN, online status, and a total count of N devices. DG gateways can host sub-measurement devices and sub-control devices (e.g. electric proportional ball valves, relay controllers, magnetic flow meters).
Sub-device Management
- Sub-devices (
/devices/dg/subdevice): bind measurement sub-devices (temperature / flow) to a DG gateway. - Measurement support (
/devices/dg/support/meas): range, unit and acquisition settings. - Control support (
/devices/dg/support/ctrl): control commands for sub-control devices (valve opening, relay on/off).
06Data Viewing
Data viewing covers TG real-time data, DG data status, history and temperature curves — the daily core of the platform.
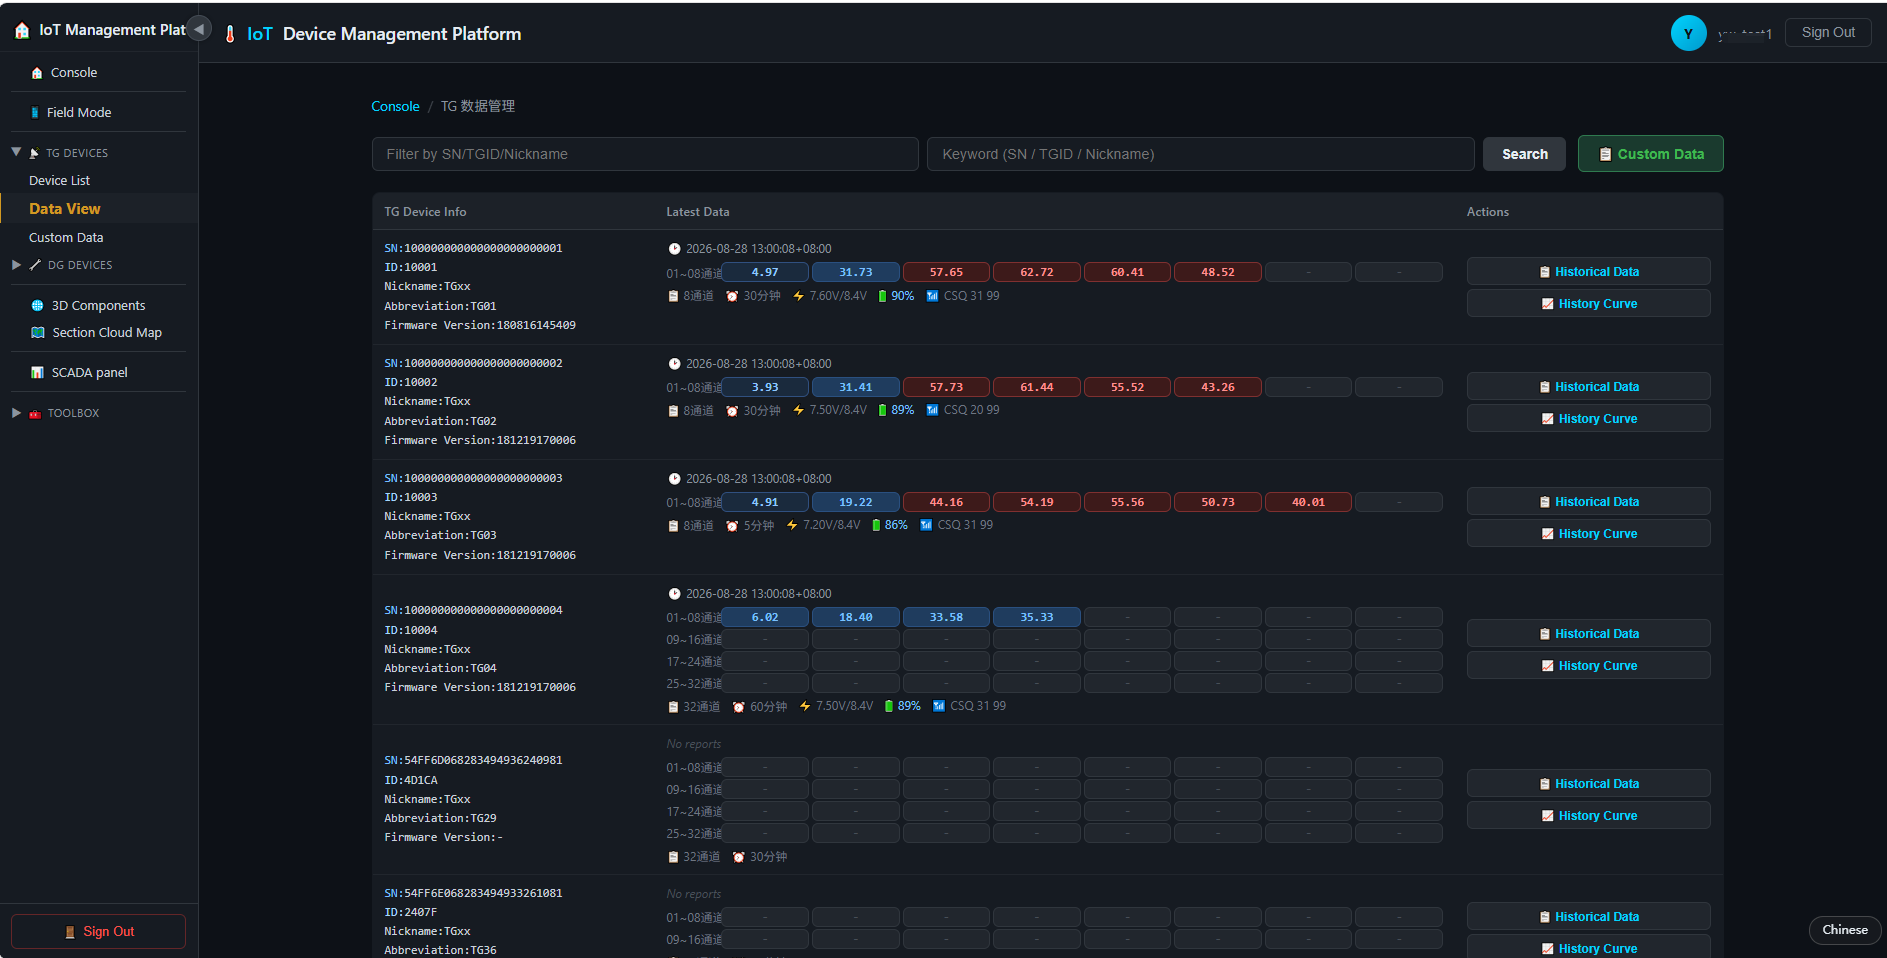
TG Real-time Data (/data/tg)
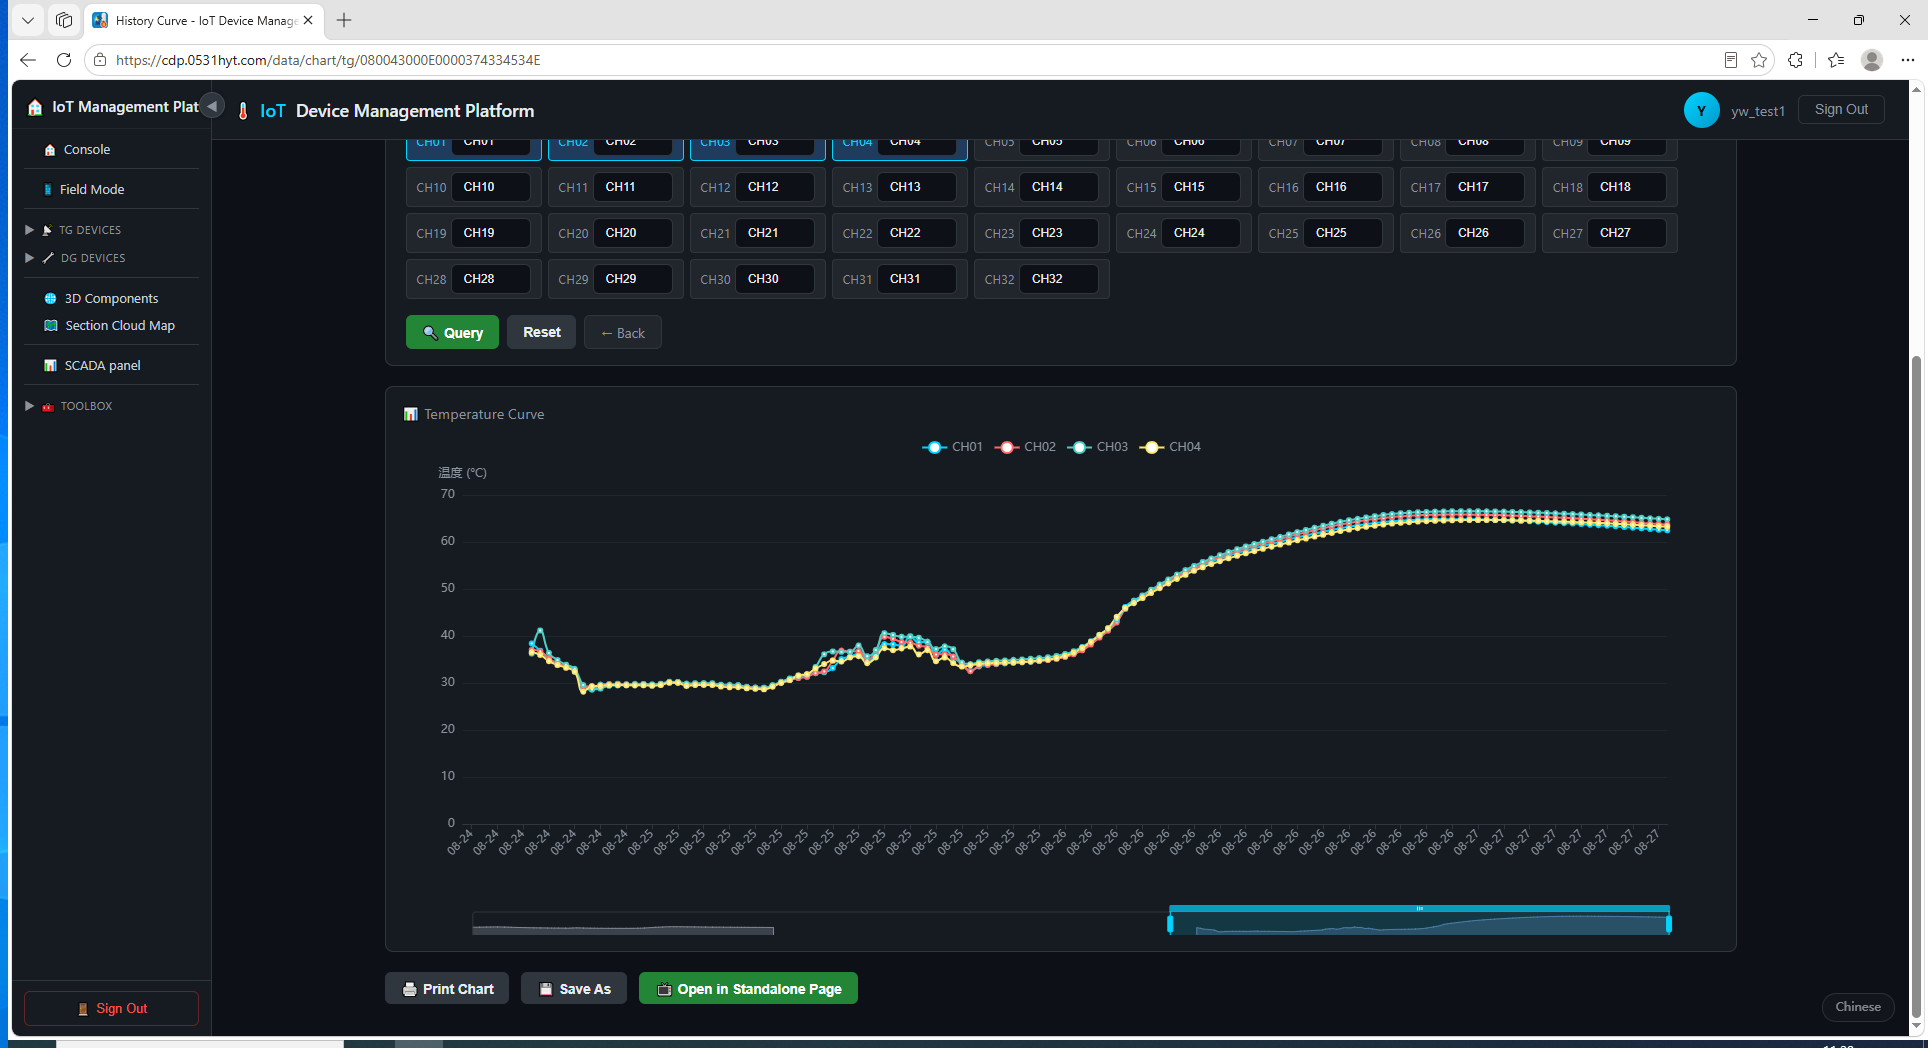
- Browse real-time temperatures per channel, searching by SN / TGID / nickname.
- Pagination shows "Total N entries, page X-Y".
- Click a device to open its temperature curve page (
/data/chart/{dtype}/{sn}, ECharts) with multi-channel comparison.
DG Data Status (/data/dg)
Shows the status of DG gateways and their sub-devices — sub-measurement values (temperature, flow) and sub-control states (valve opening, relay state).
- Sub-device values: e.g. "Electric Proportional Ball Valve Position Query", "hydb_jdk16 16-Channel Relay Controller", "Shangwei Magnetic Flowmeter".
- Local (self): DG gateway self status (power, signal, uptime).
- Control commands: send opening / on-off commands to sub-control devices (requires control permission).
History (/data/history/{dtype})
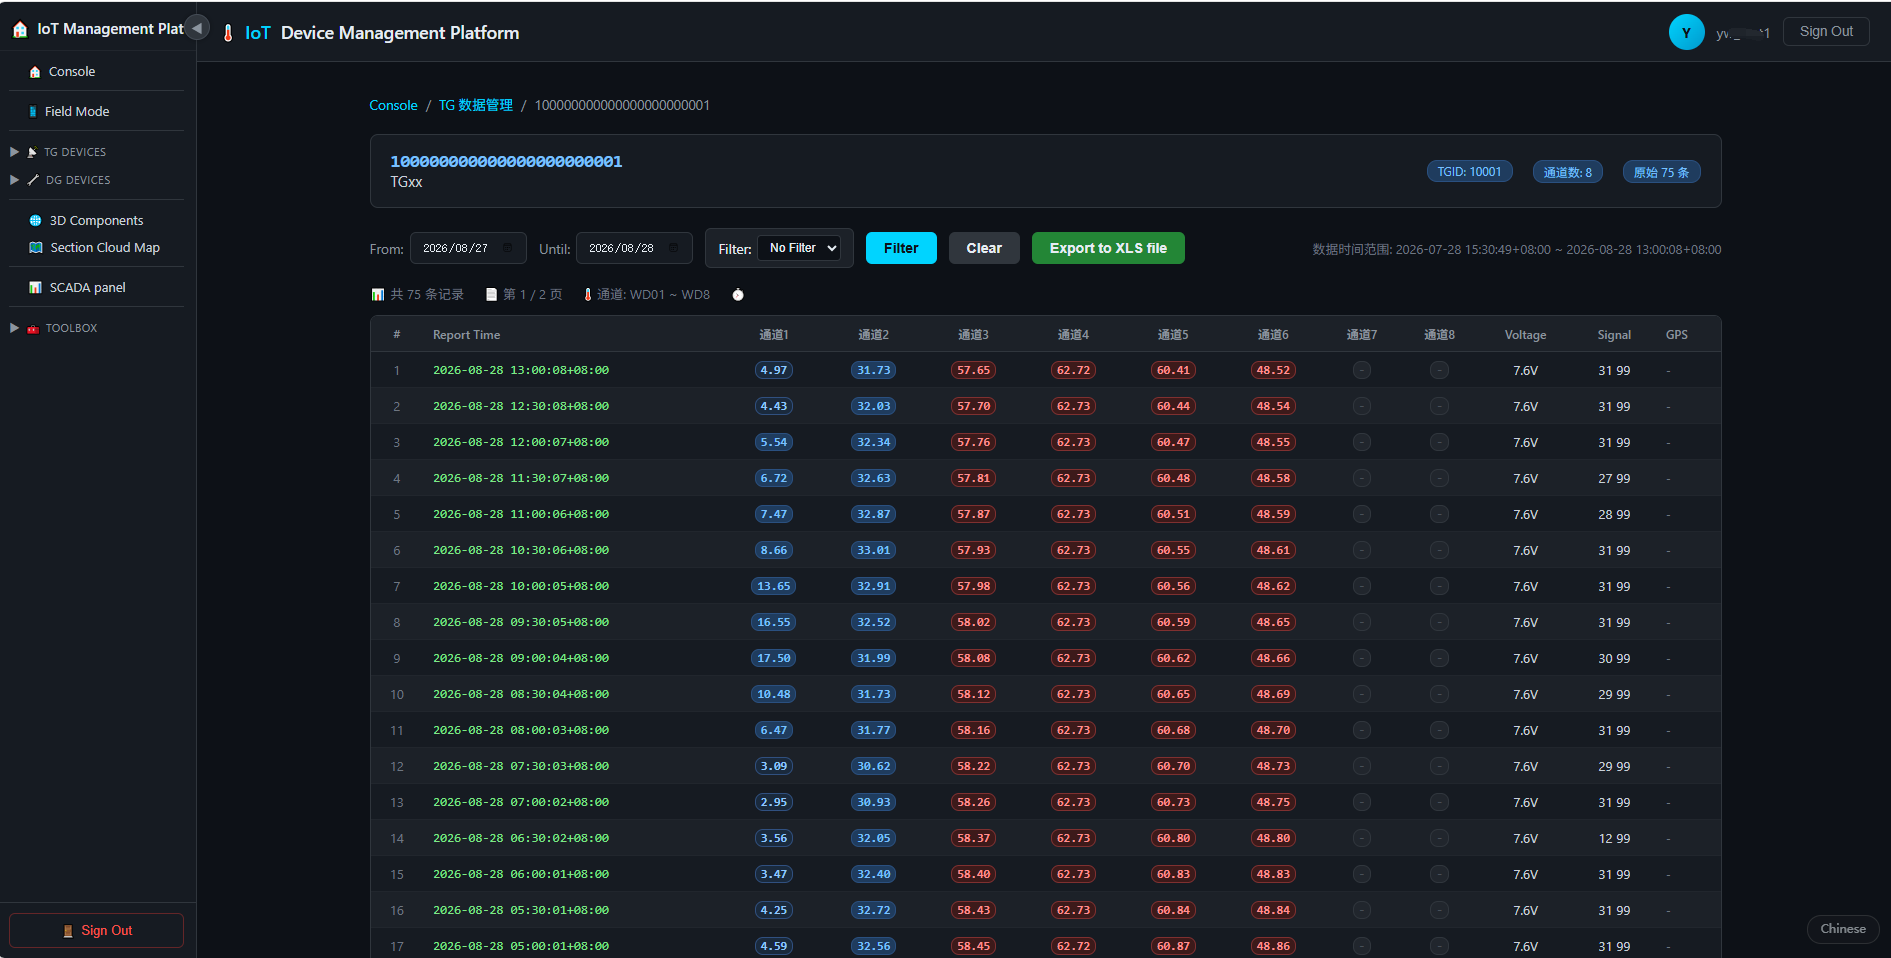
Select data type (TG / DG), device and time range to review historical data; export by time point for offline analysis.
07Custom Data System
The Custom Data System (/custom-data) is a core value-add: organize your devices and channels into data groups, configure real-time / history charts and C5-9 compliance reports, and customize chart headers — a true WYSIWYG reporting experience.
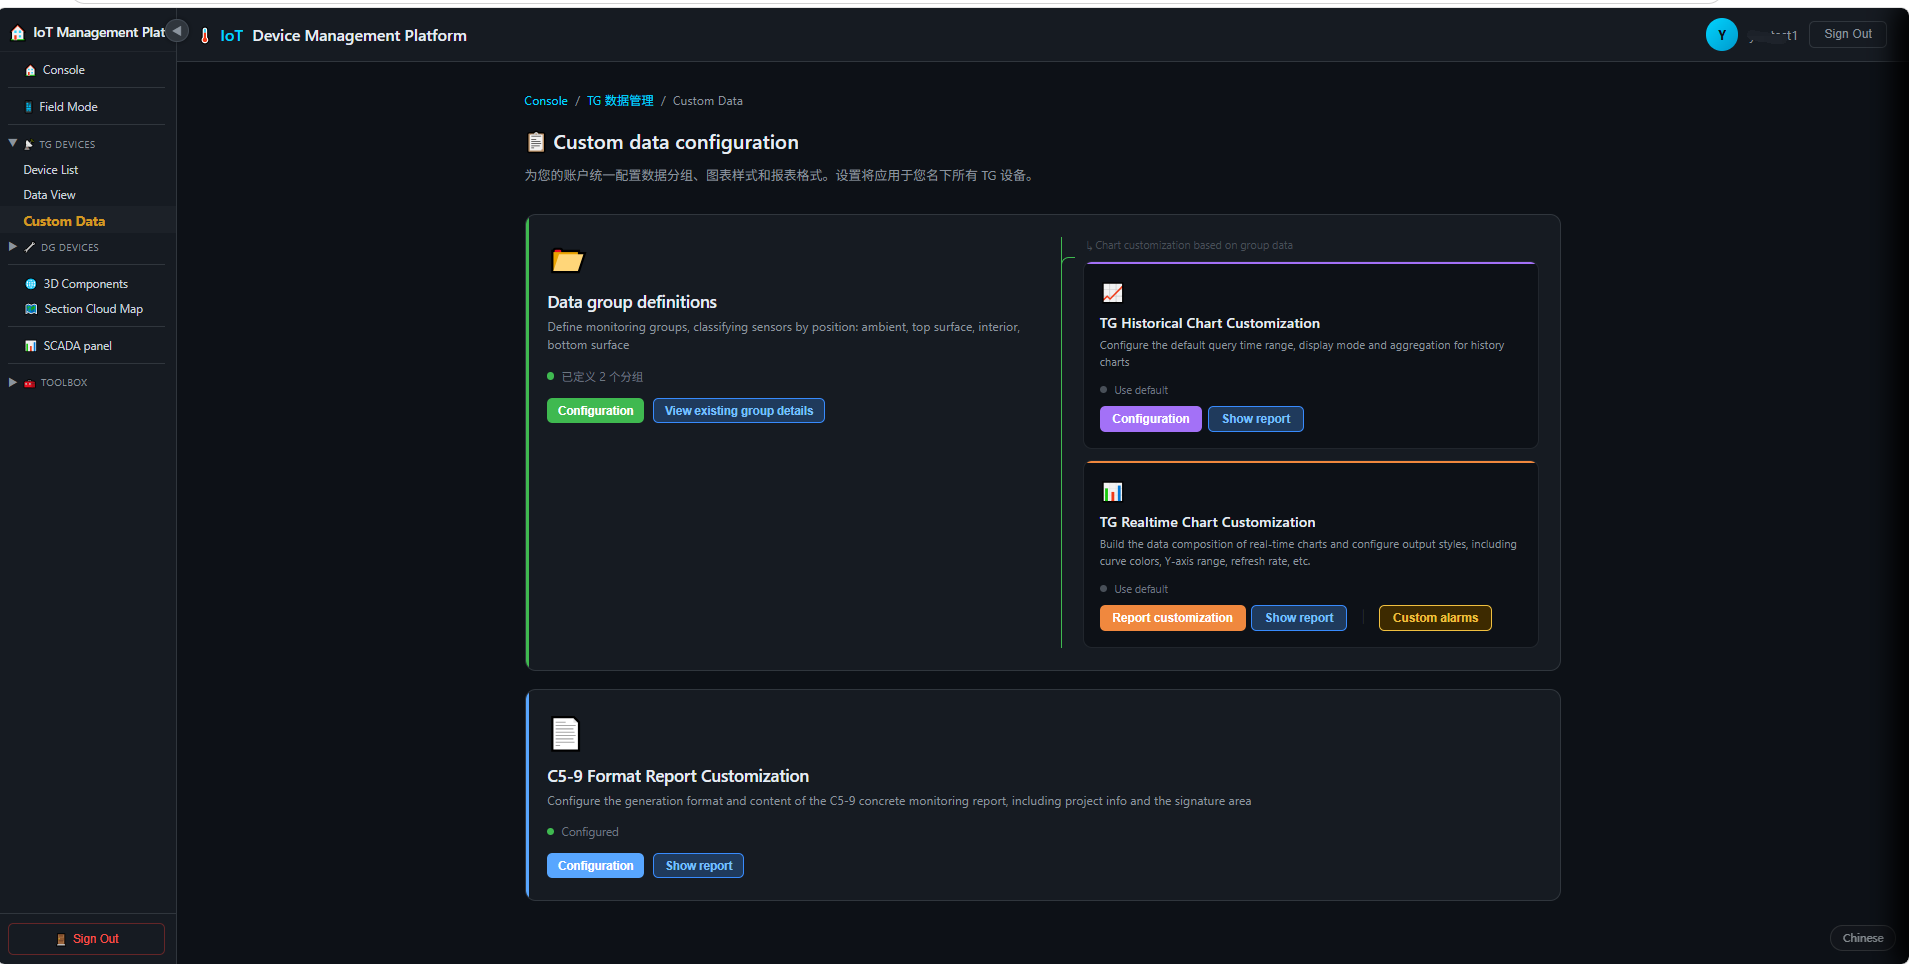
Data Groups
Group frequently used channels (e.g. "1# Pile Cap", "2# Base Slab") so charts and reports load in one click without re-selecting channels.
Real-time Chart Config
- Pick group and channels, set temperature thresholds (out-of-range color) and refresh interval (second-level auto refresh).
- Real-time curves are ideal for continuous monitoring during concrete pouring.
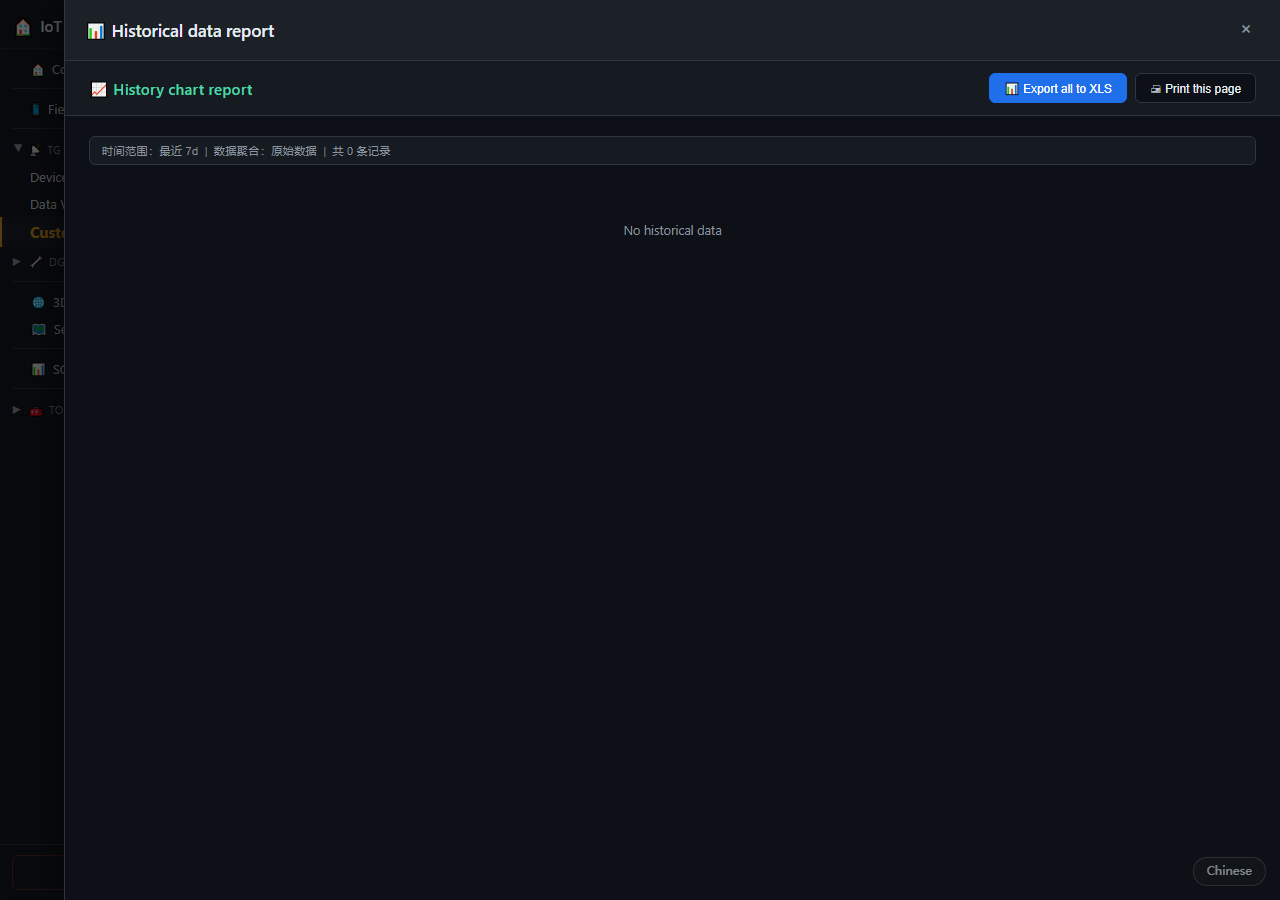
History Chart Customization (1d ~ 30d / custom)
Configure channels and time range (quick presets 1 / 7 / 30 days, or custom start-end) for temperature-rise analysis and curing records.
C5-9 Compliance Reports
- Generates temperature reports in the national standard format for mass concrete construction.
- Built-in formula engine:
max()/min()/abs()/ average / difference. - Preview against historical data before exporting / printing.
Custom Chart Headers
Customize exported chart titles and headers (project name, location, contractor) to match your organization's report format.
08Visualization & Analysis
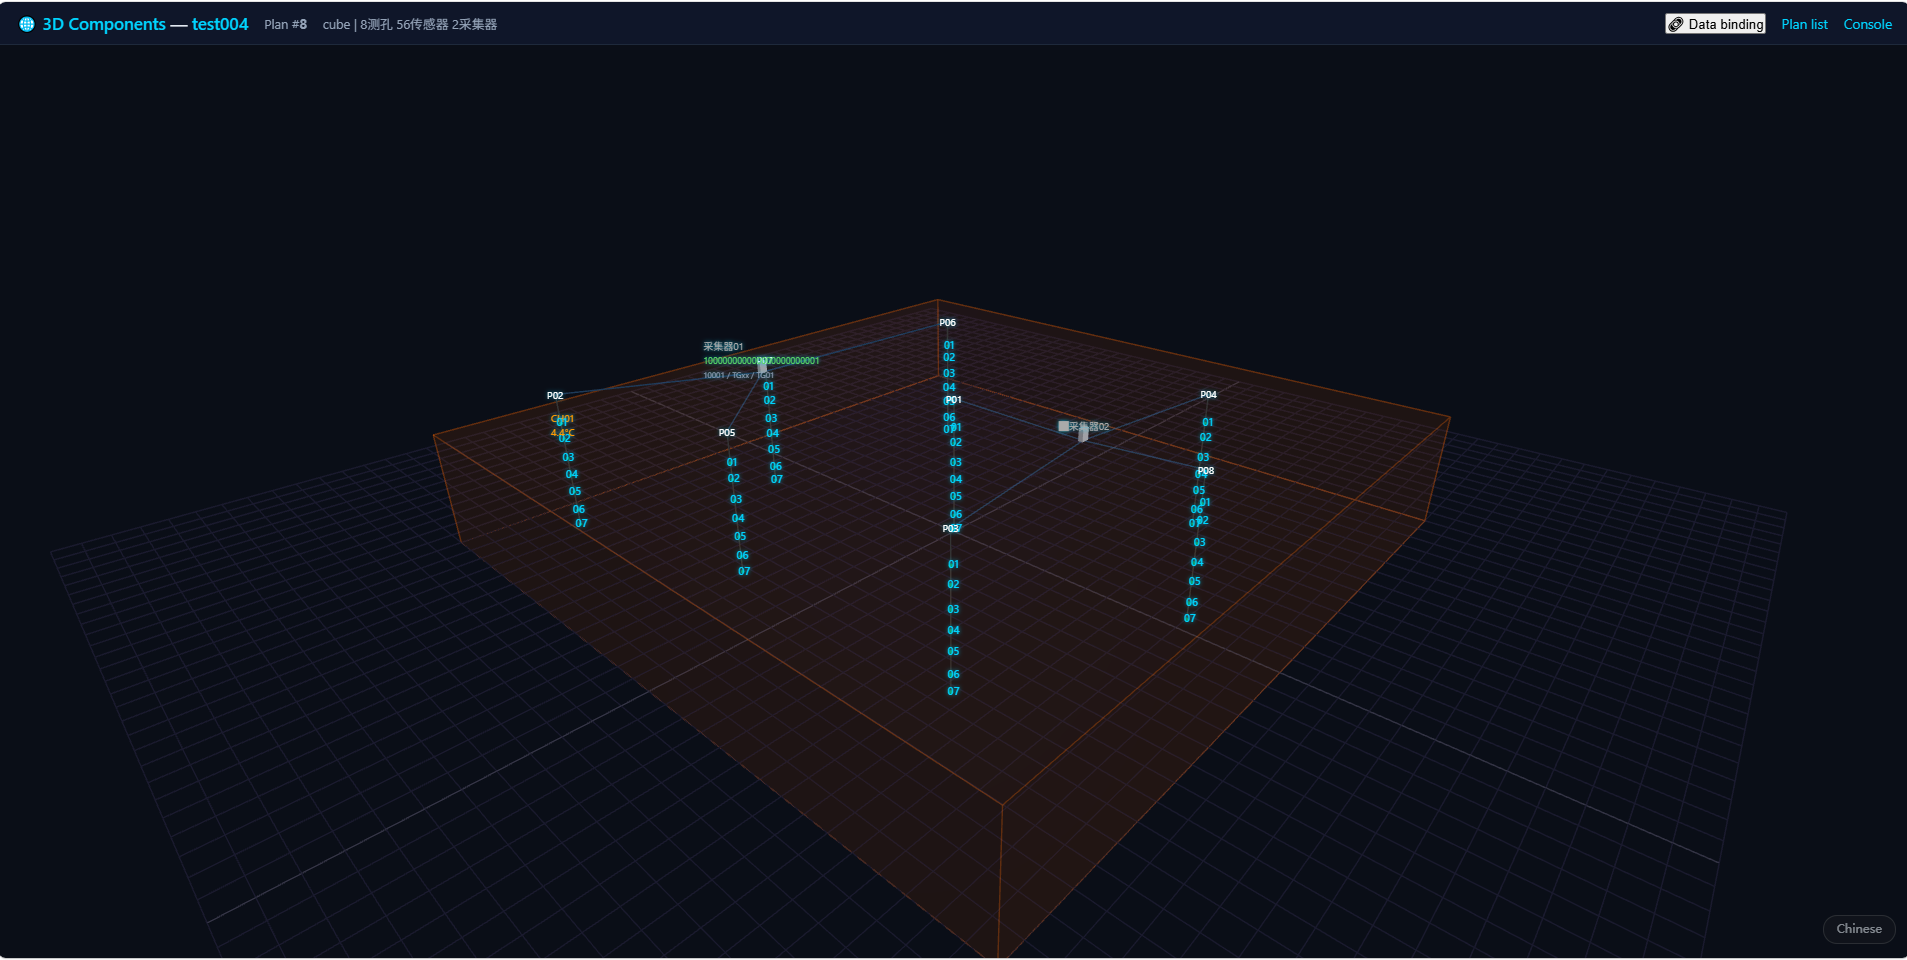
Four professional visualization capabilities: Section Cloud Maps, 3D Component Models, SCADA monitoring panels and online temperature plan generation (/solgen).
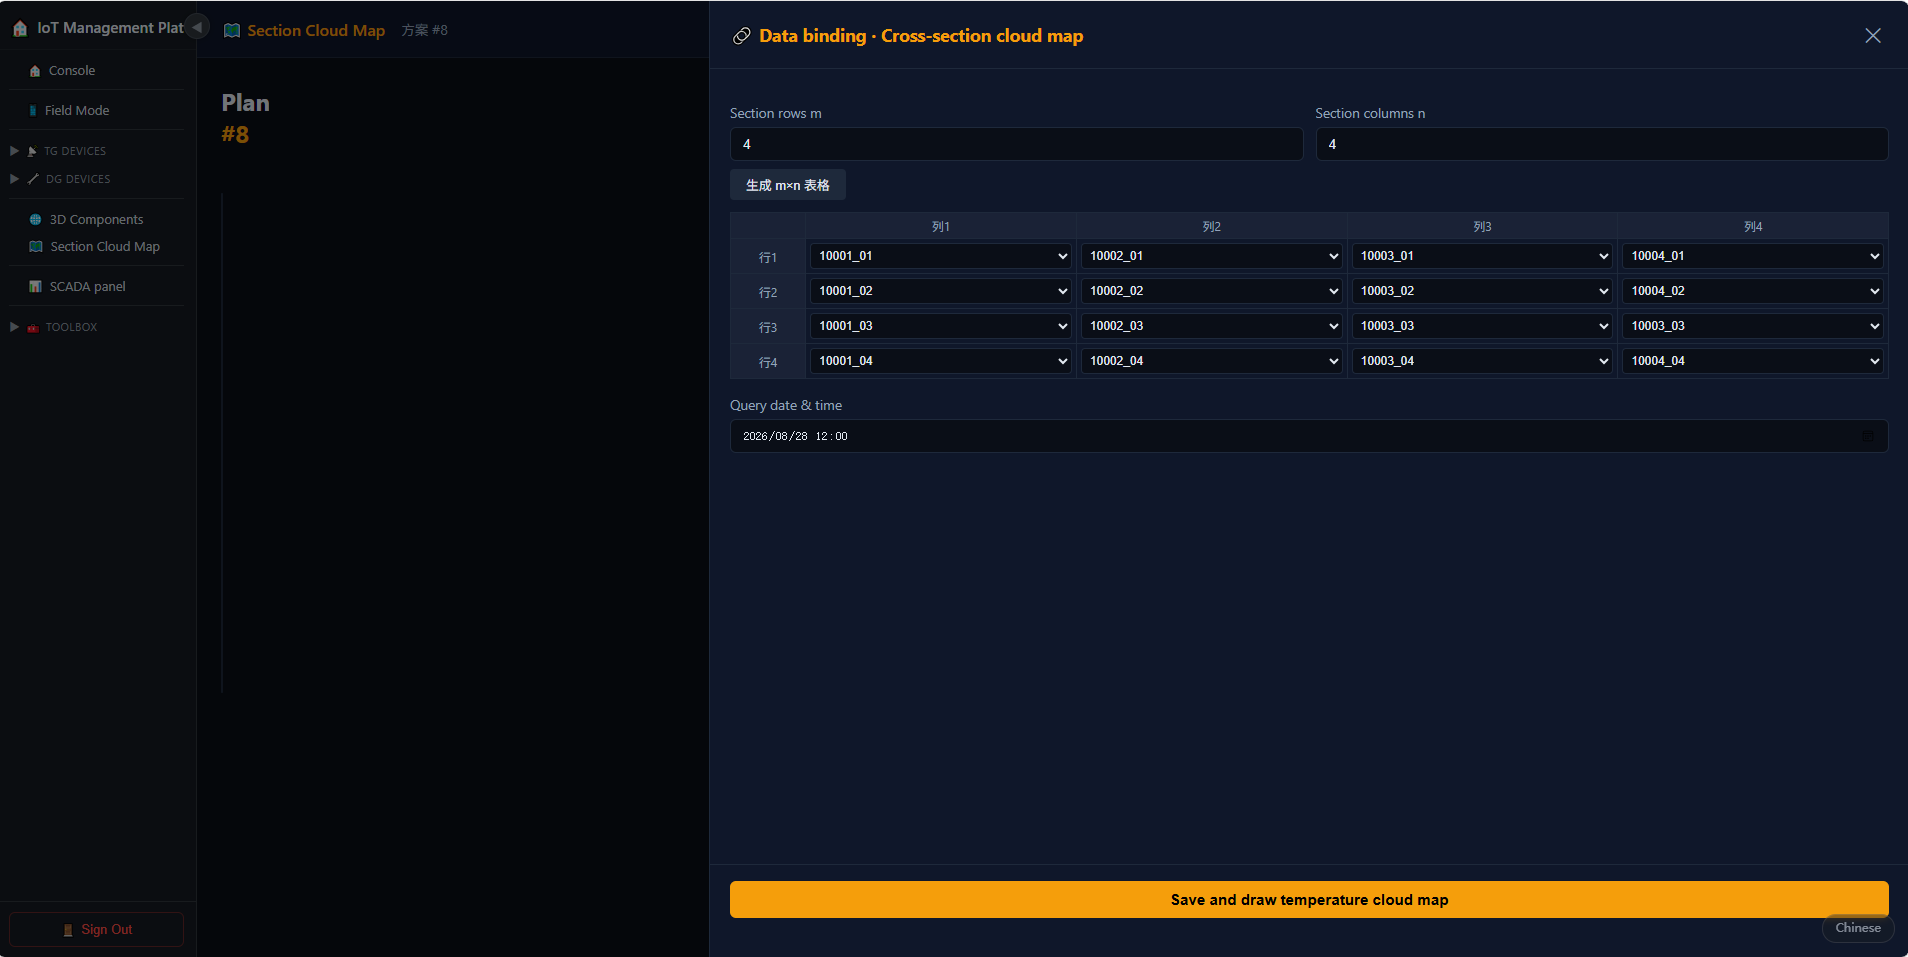
Section Cloud Maps (/section-cloud)
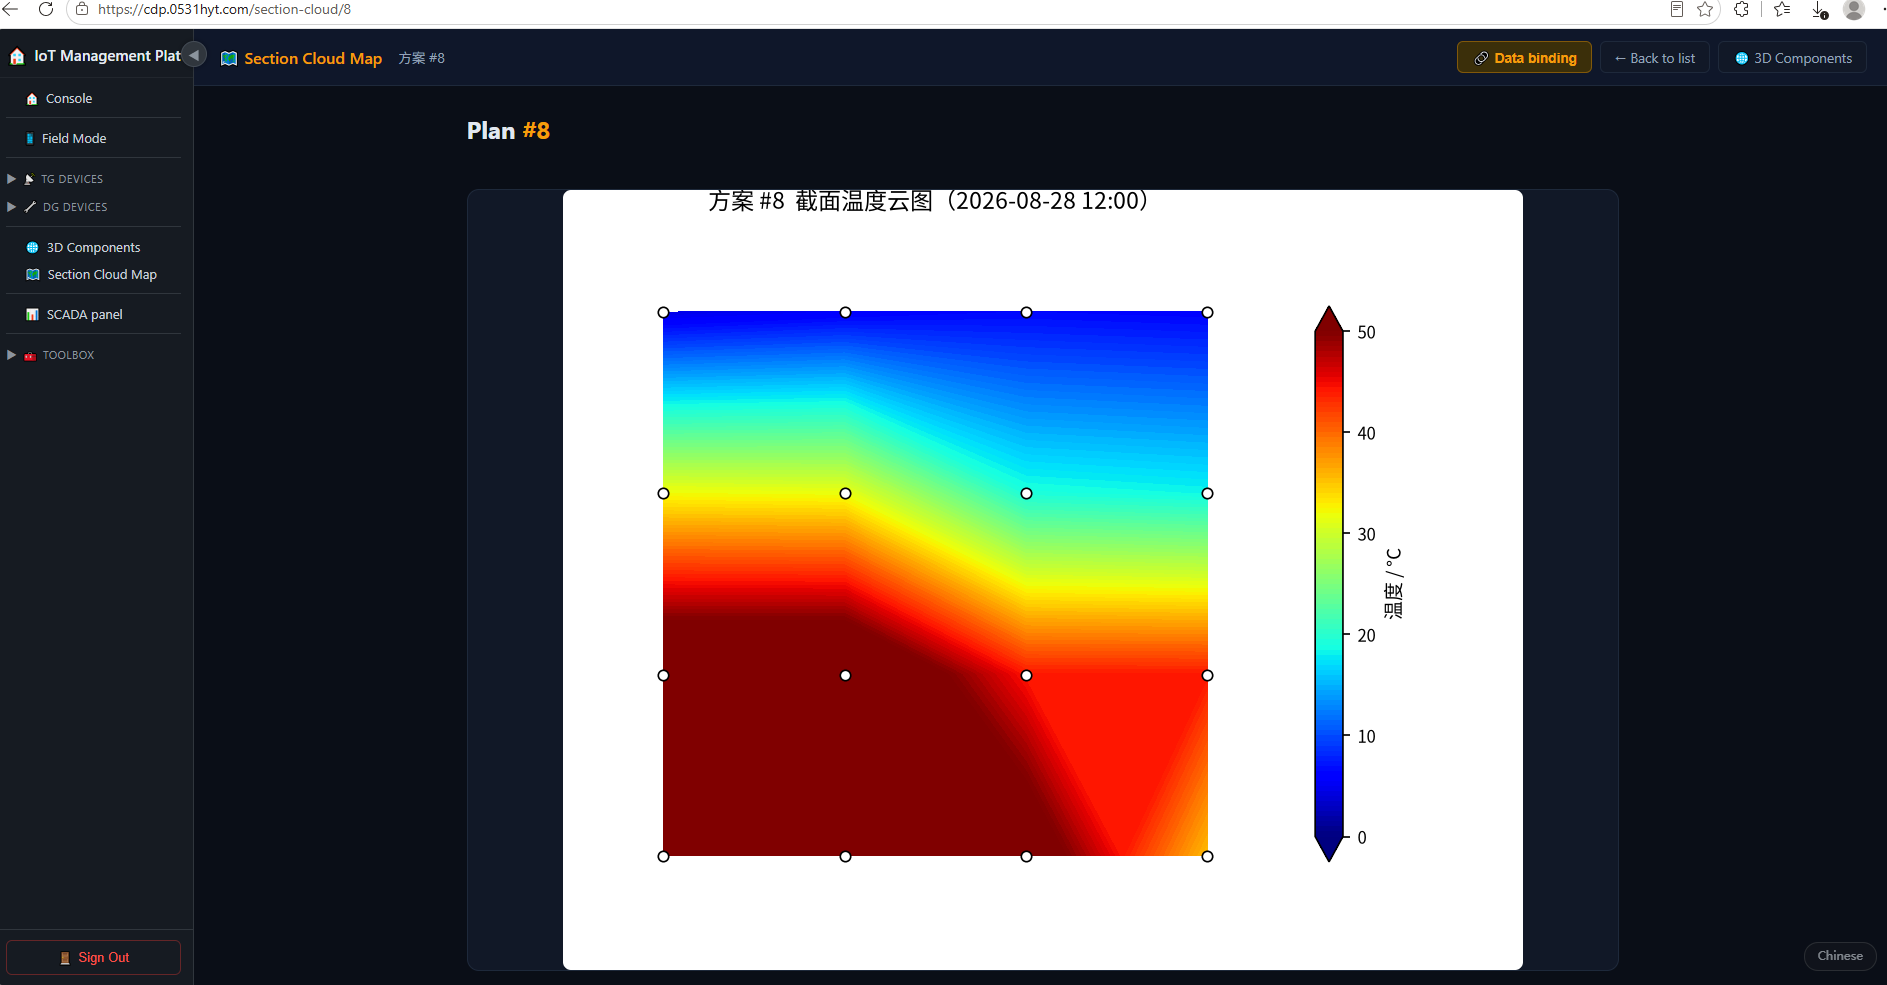
- Matplotlib
contourf-rendered temperature distribution across a concrete cross-section. - Users define an m×n grid and bind grid cells to sensor channels.
- Visualizes the internal temperature field to assess temperature-gradient risks (inner/outer delta).
3D Component Visualization (/3d)
- Load STL 3D models with temperature sensors annotated at measurement points.
- Live temperature values on the 3D model; rotate / zoom freely.
- Plan list supports search (by name or number) and pagination; click to open the 3D viewer.
Online Temperature Plan Generation (/solgen)
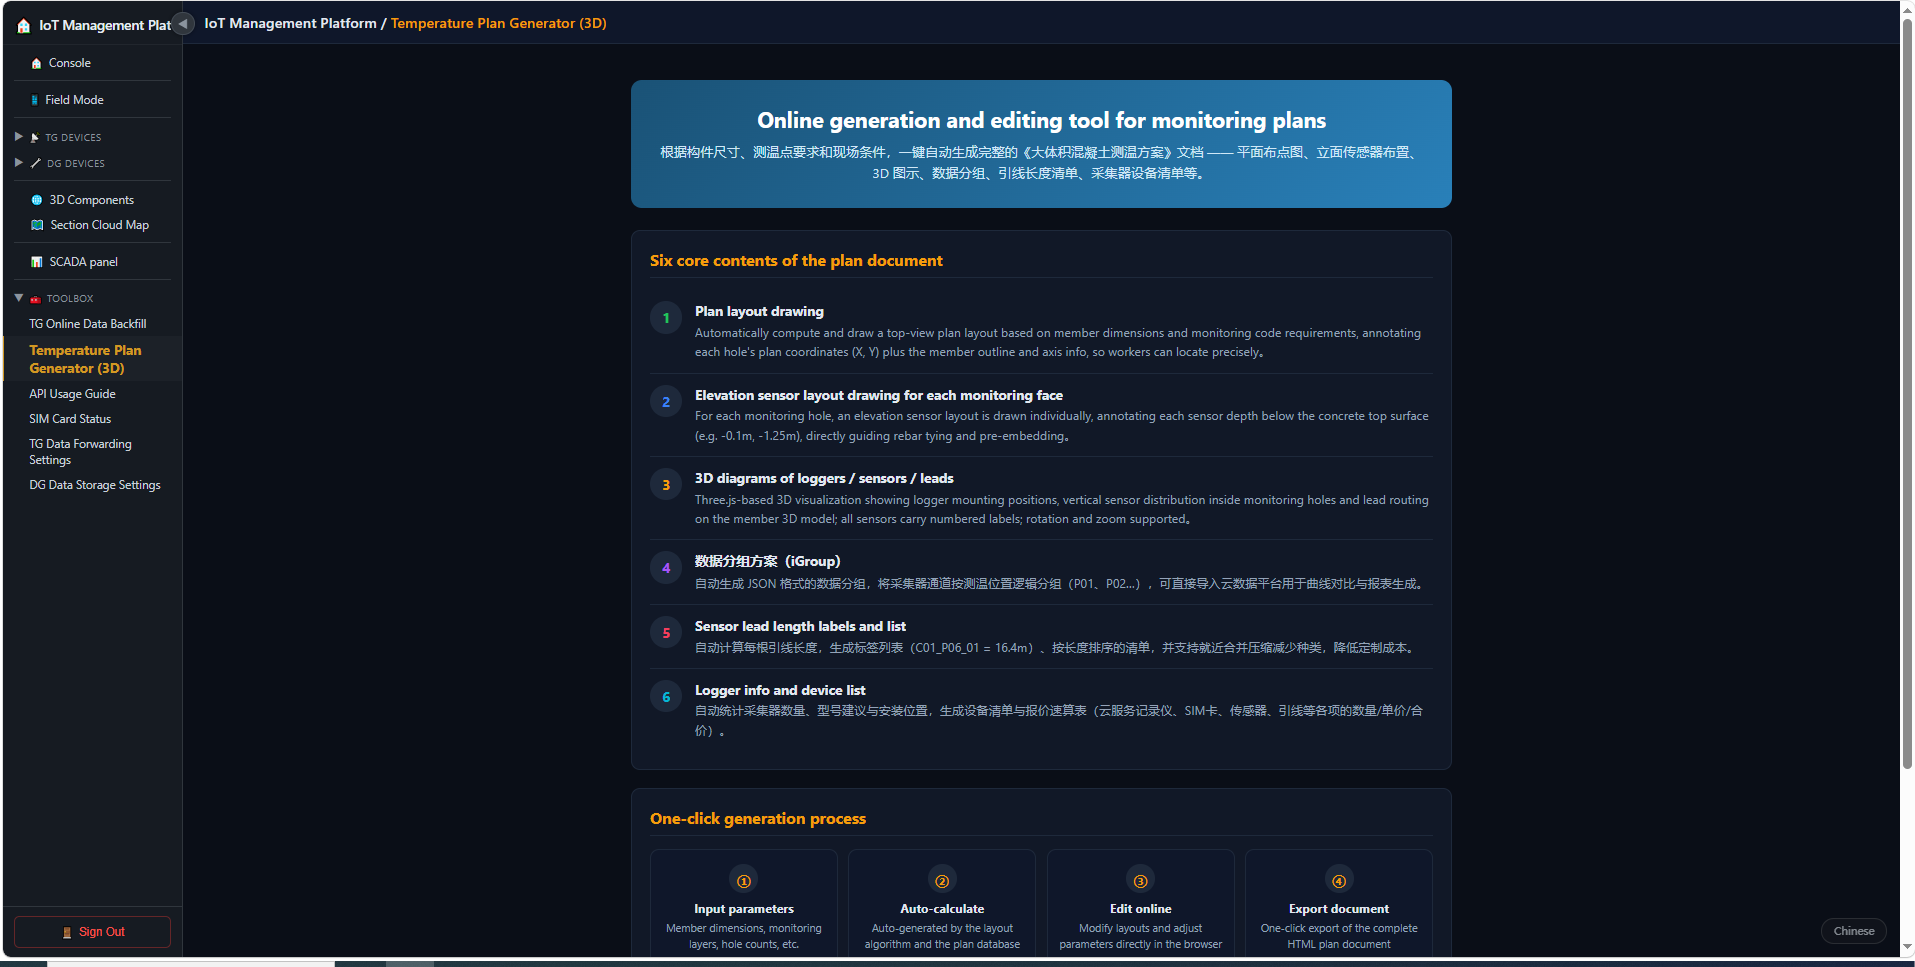
- Generate complete mass-concrete temperature plans in one click from component dimensions, sensor requirements and site conditions.
- Outputs include layout drawings, elevation sensor layout per hole, 3D views of collectors/sensors/cables.
- Auto-generates JSON data group schemes (Group) that can be imported directly for curve comparison and report generation.
- Also outputs cable length labels, collector info and device lists for procurement and construction handover.
SCADA Monitoring Panels
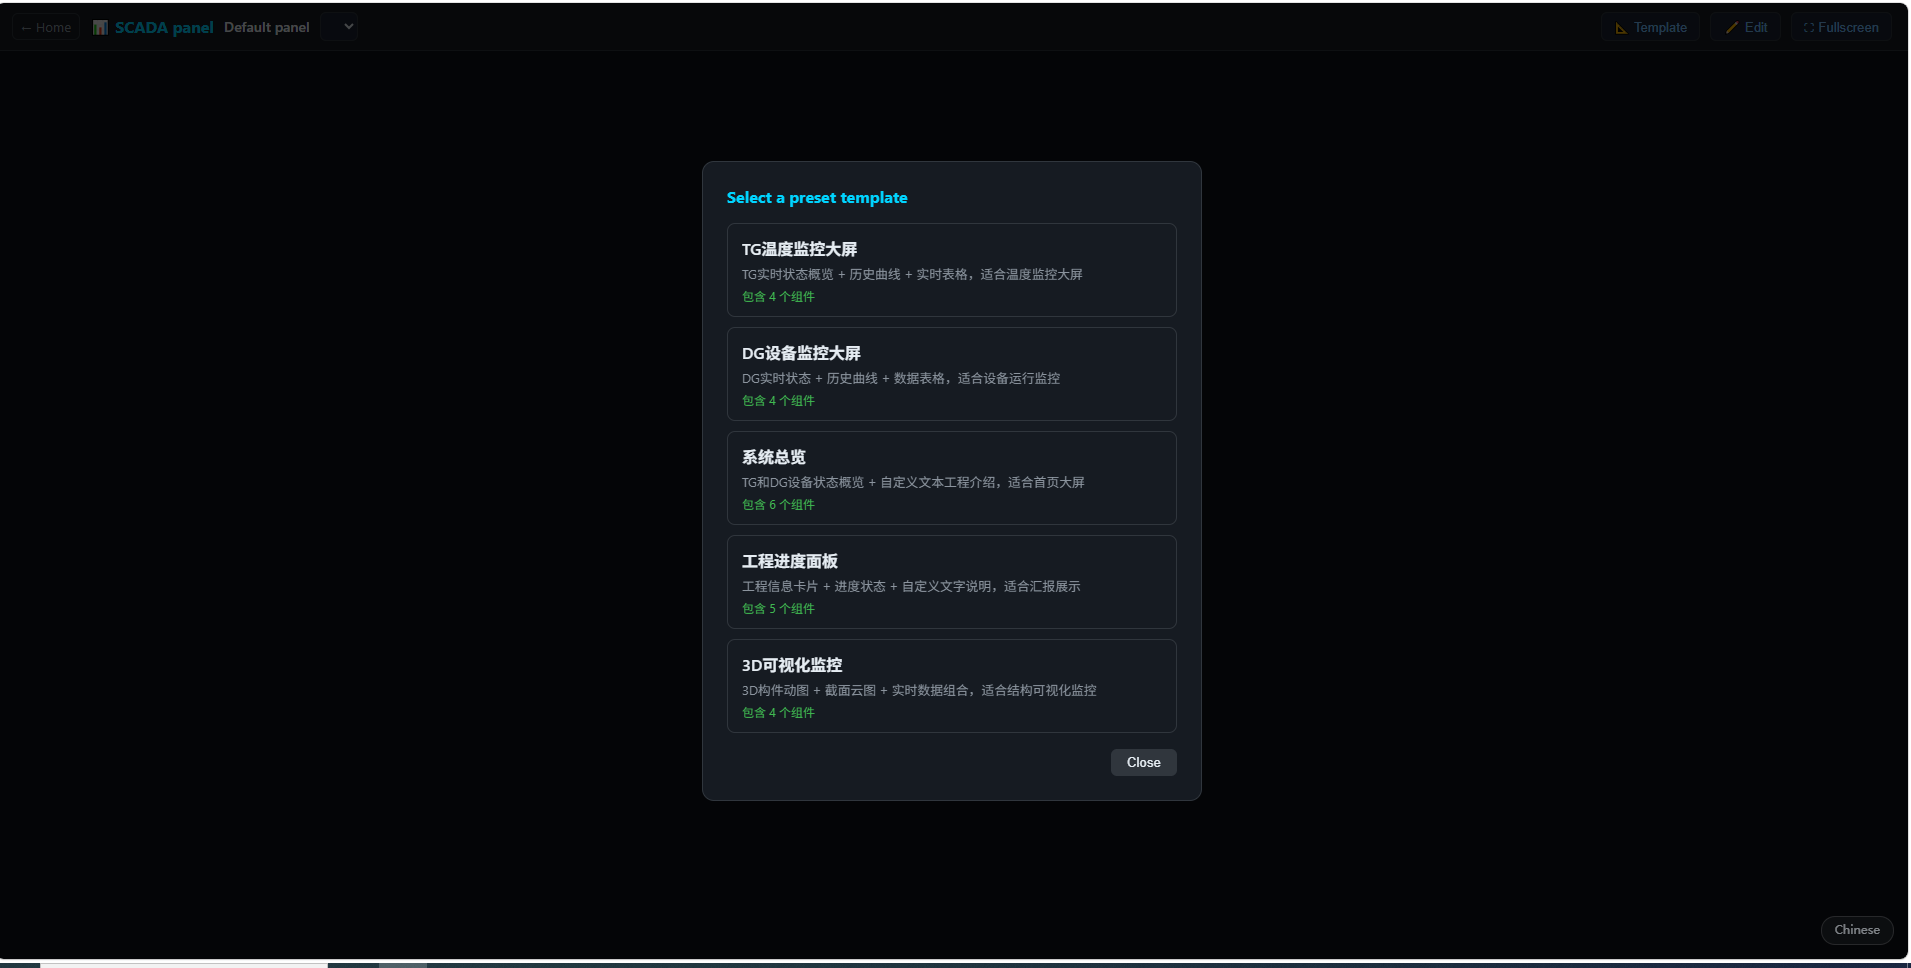
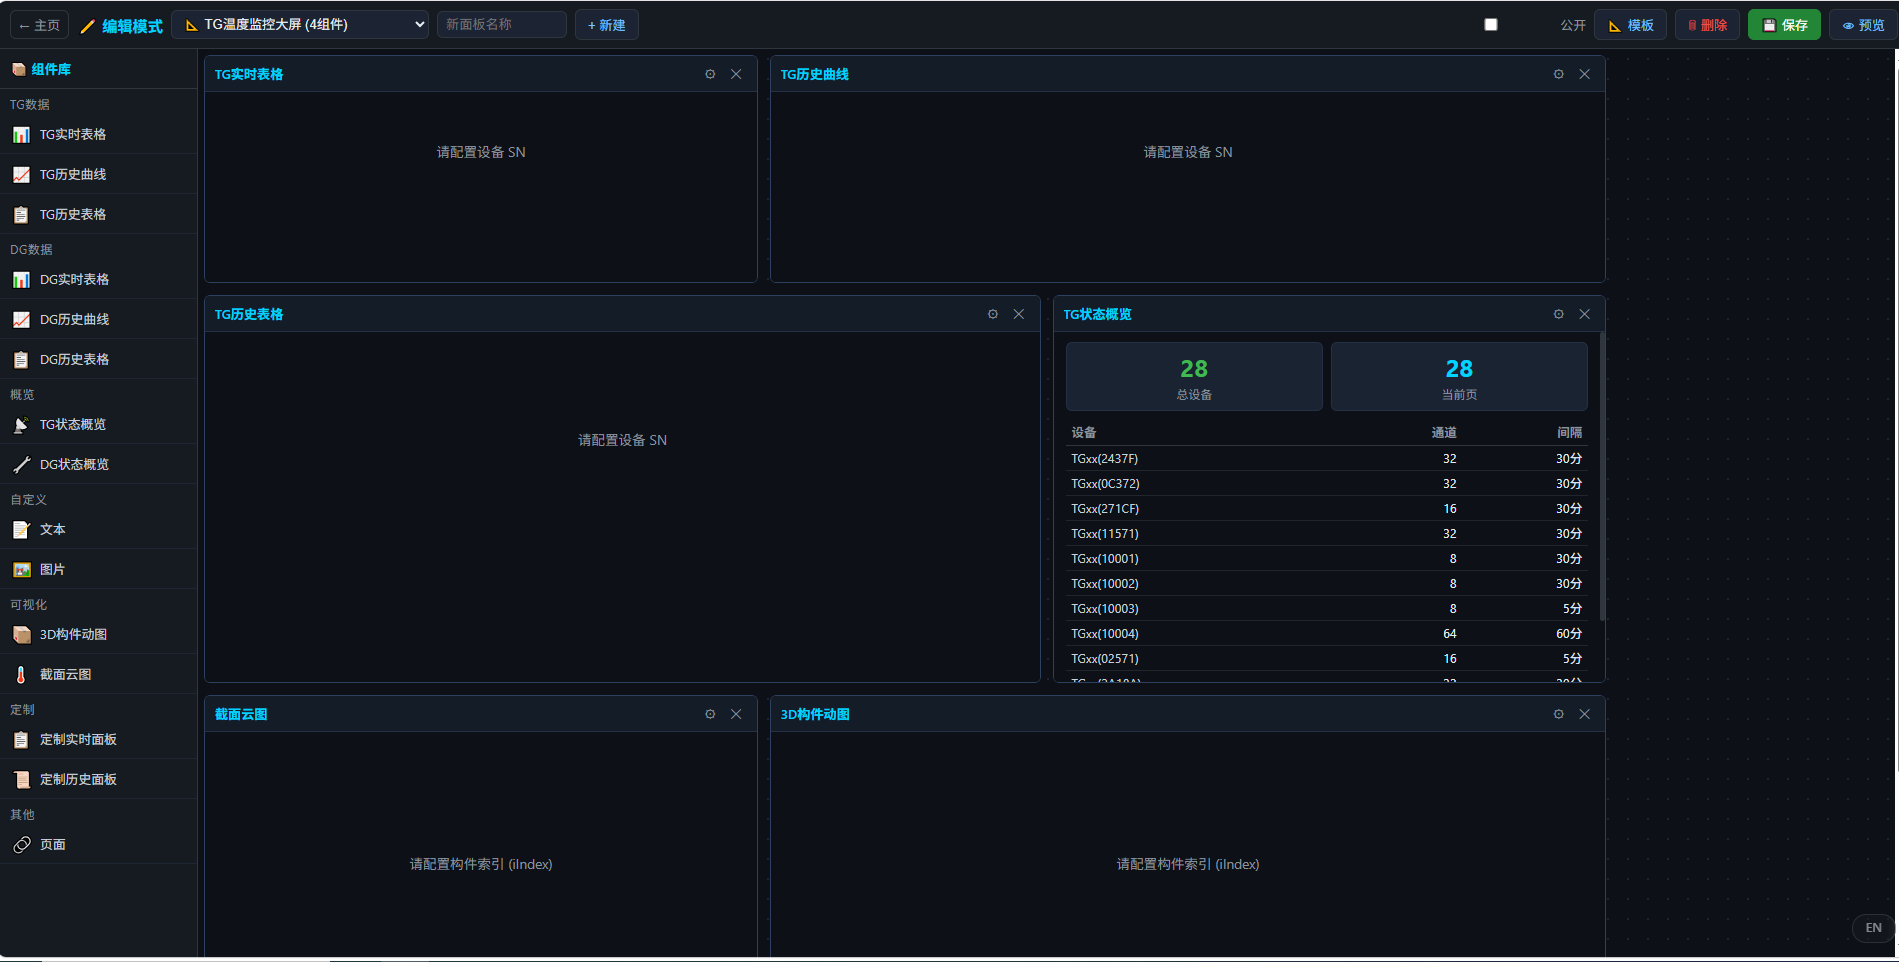
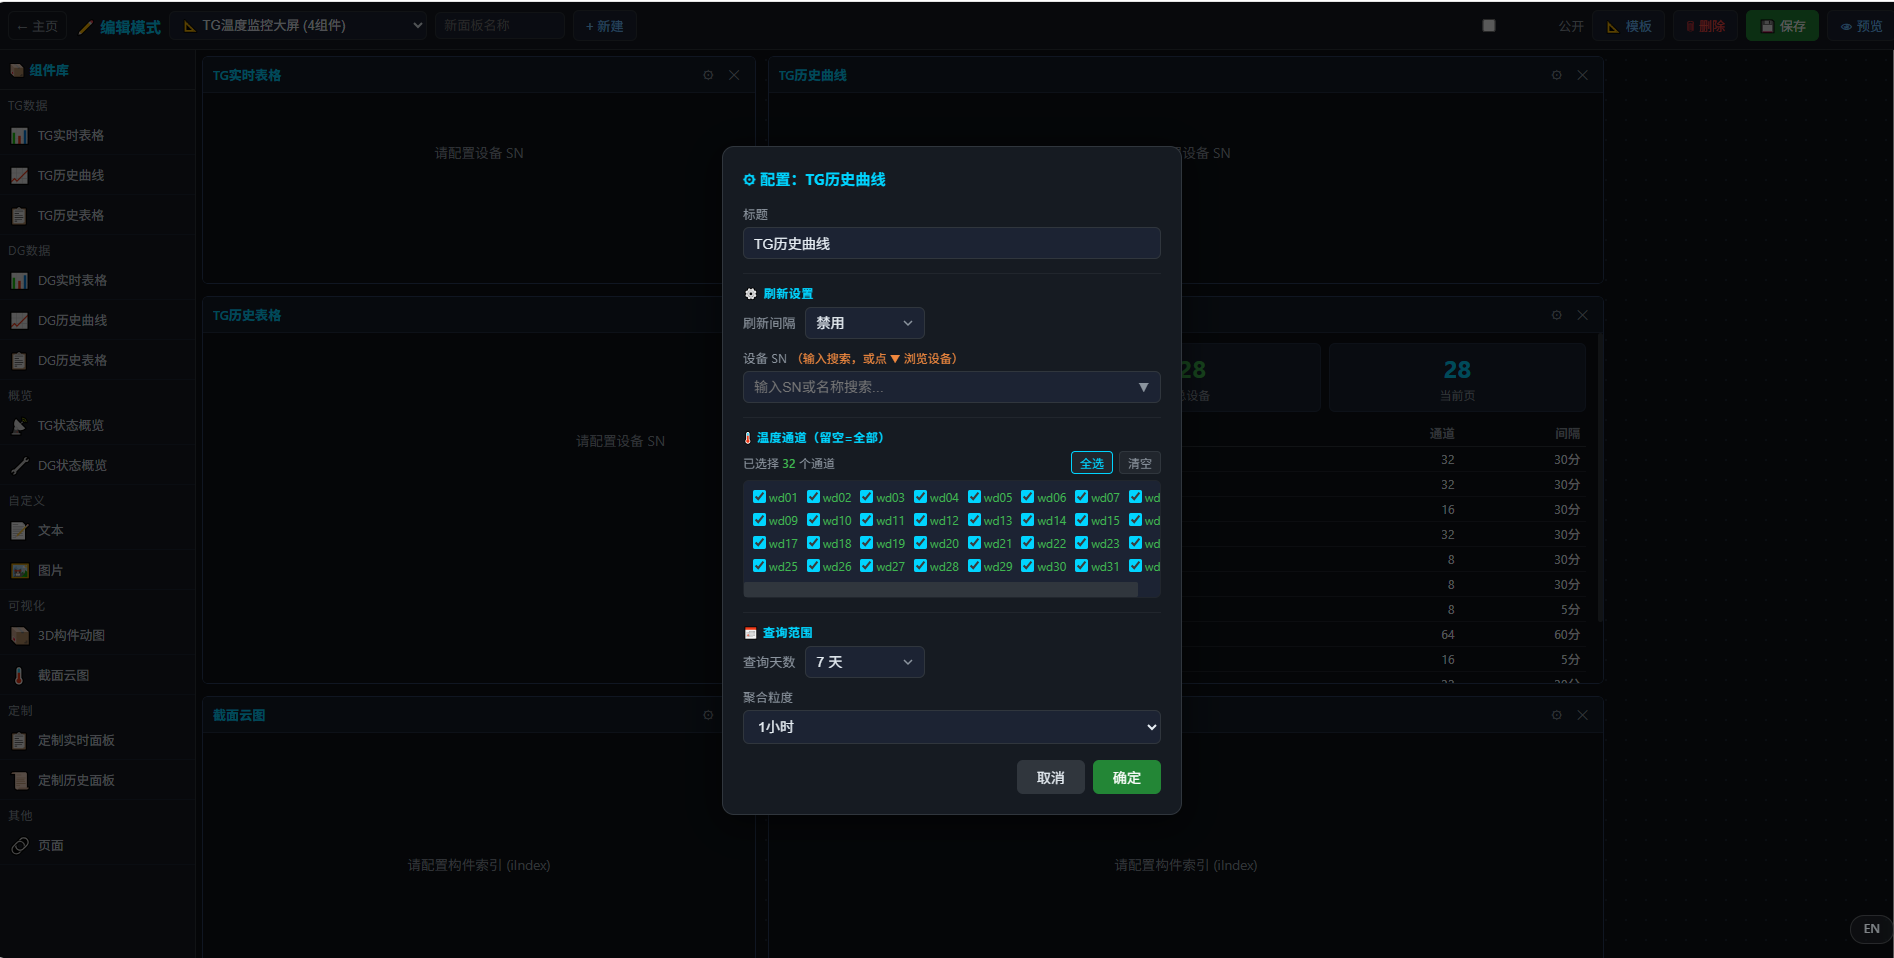
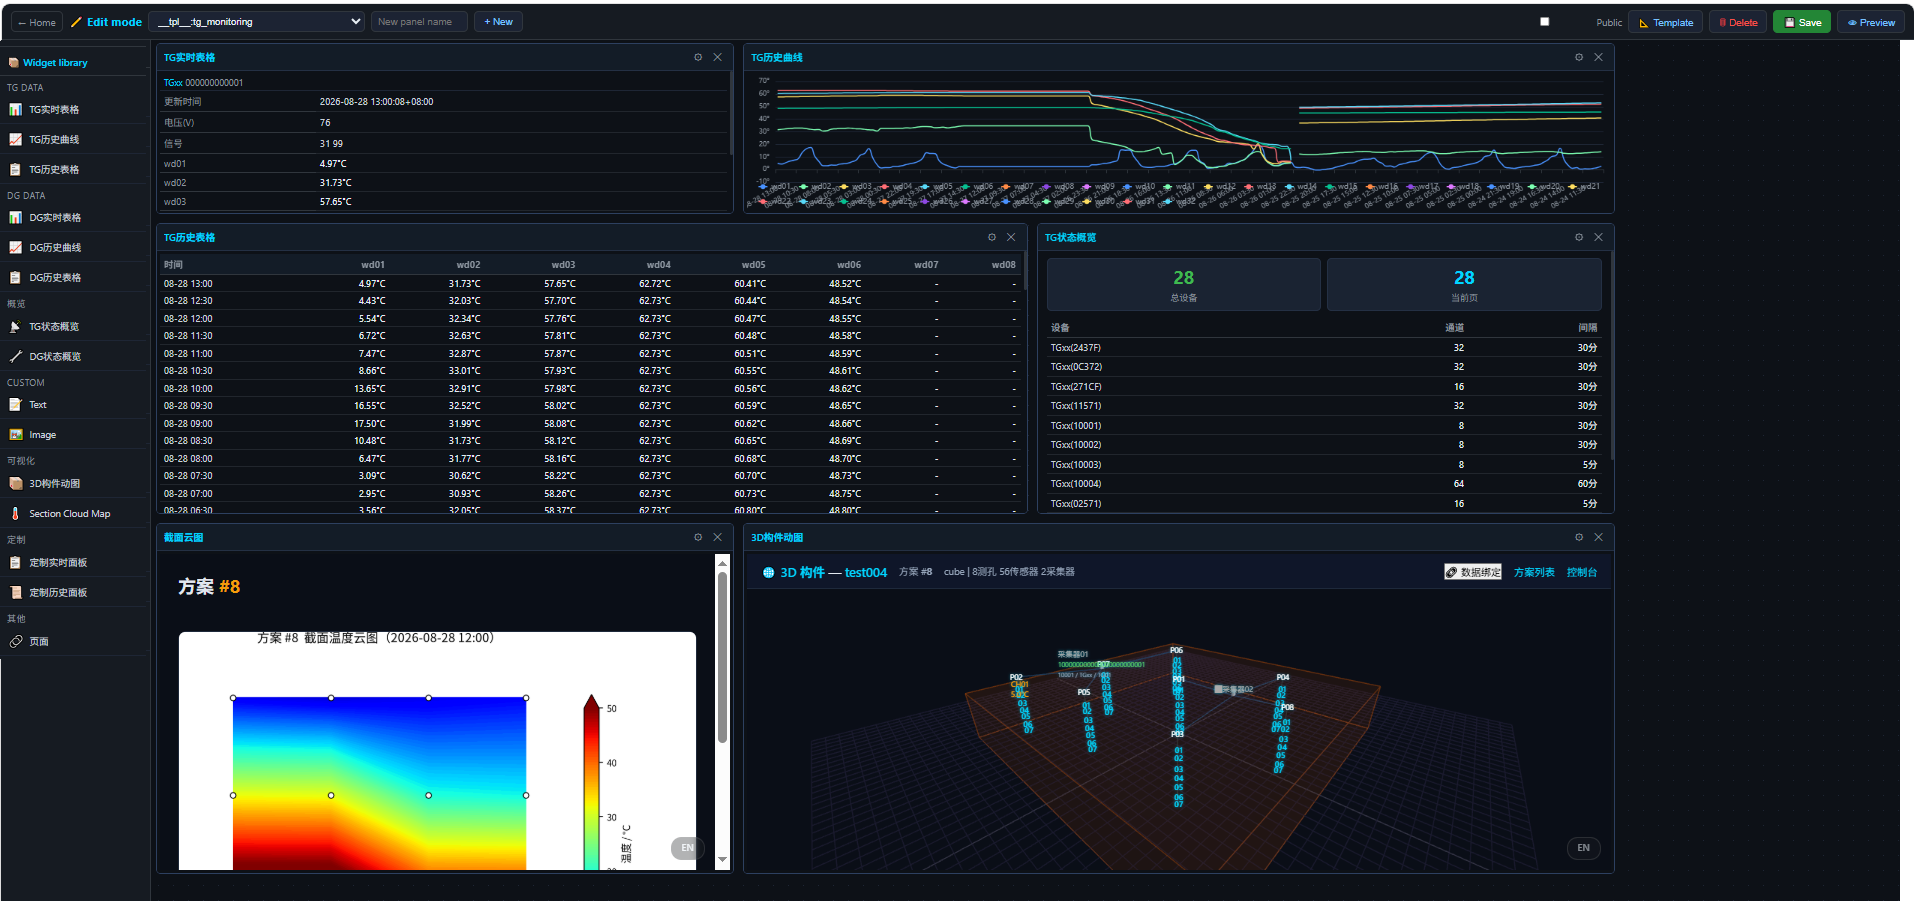
- Drag-and-drop freeform layout built on Gridstack.js.
- 13 widget types: real-time tables/charts, 3D model animation, section cloud maps, status overview, custom text/HTML, embedded pages, etc.
- 5 preset templates to start quickly; multi-user multi-panel with public sharing (
/viewer). - Ideal for project big screens, control rooms and review presentations.
09Data Forwarding & Push
Data forwarding streams device data to third-party systems: TG forwarding (/toolbox/tg-push) and DG push (/toolbox/dg-push). Once configured, every device report is forwarded to your endpoint.
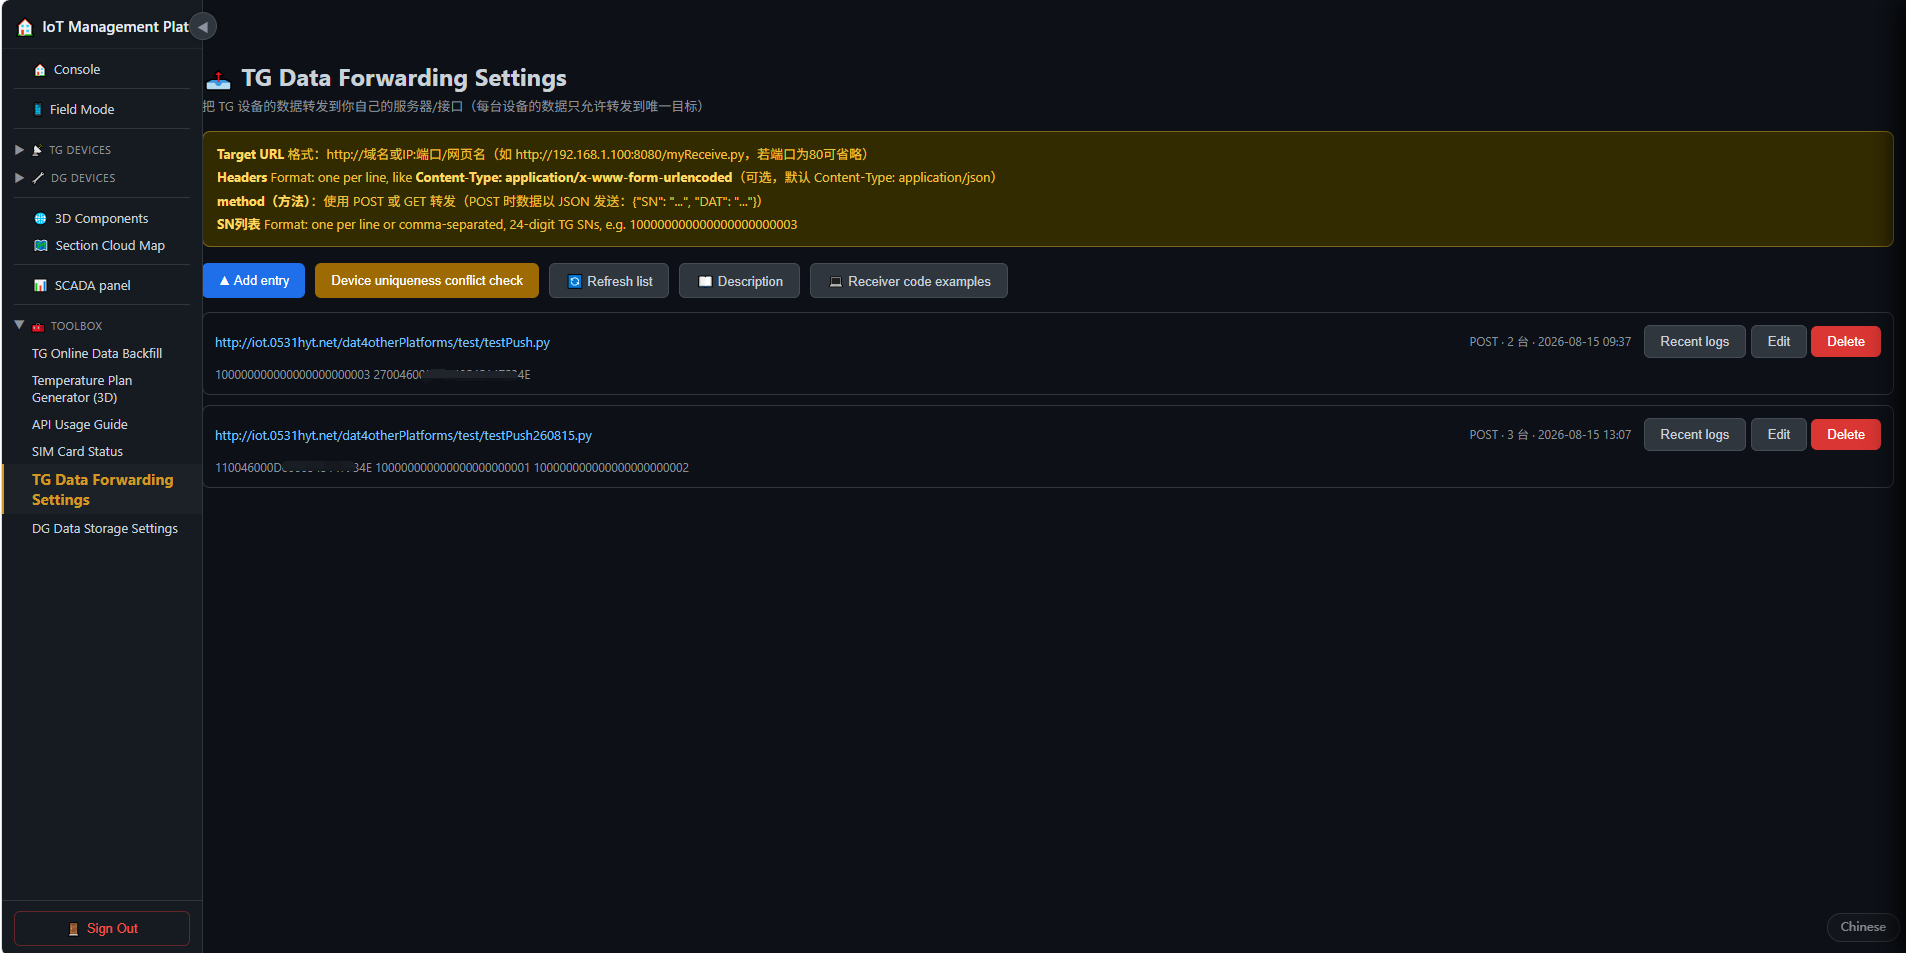
Forwarding Rule Config
| Setting | Description |
|---|---|
| Rule name | A recognizable name for the rule |
| SN selection | Devices to forward (SN is globally unique — one SN can be used by only one rule) |
| Target URL | Third-party endpoint (http / https) |
| Method | POST (recommended) or GET |
| Headers | Custom headers (Authorization, Content-Type, etc.) with variable injection |
| Data fields | JSON with uppercase field names + DAT dictionary; internal server fields removed |
Forwarding Logs
- View the latest 50 logs per rule at
/toolbox/tg-push-logs(or in the config page). - Logs include target URL, headers, method, payload and the third-party response.
- Logs are auto-cleaned after 7 days; manual clearing is also available.
Typical Use Cases
- Feed a customer-owned monitoring platform or big screen in real time.
- Forward to a message broker (MQTT / WeChat mini-program backend) for mobile alerts.
- Push DG gateway data into a corporate database for further analysis.
DG Data Push (/toolbox/dg-push)
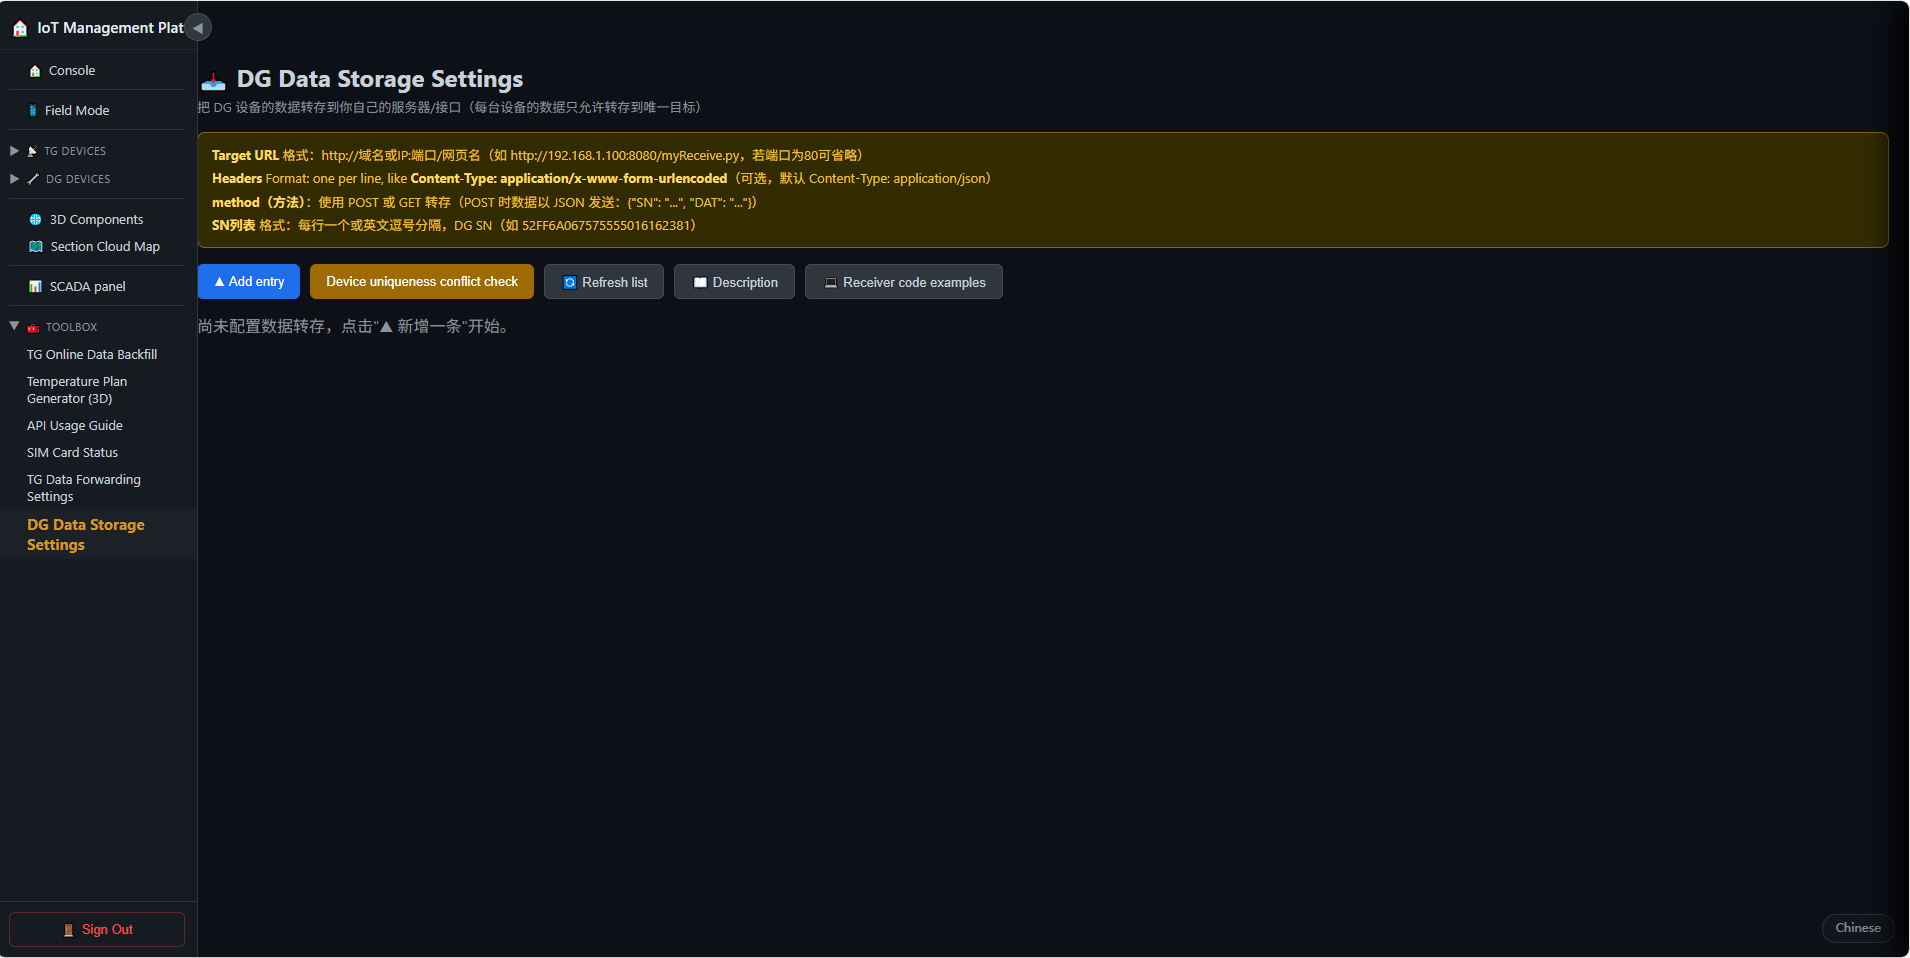
DG Data Push streams real-time data from DG gateways and their sub-measurement / sub-control devices to third-party platforms. Rule and log management is similar to TG forwarding under Toolbox → DG Data Push.
10Alarm Rules & Push
Alarms live inside /custom-data and trigger on temperature threshold violations. The system runs alarm checks periodically and pushes notifications through the configured channels.
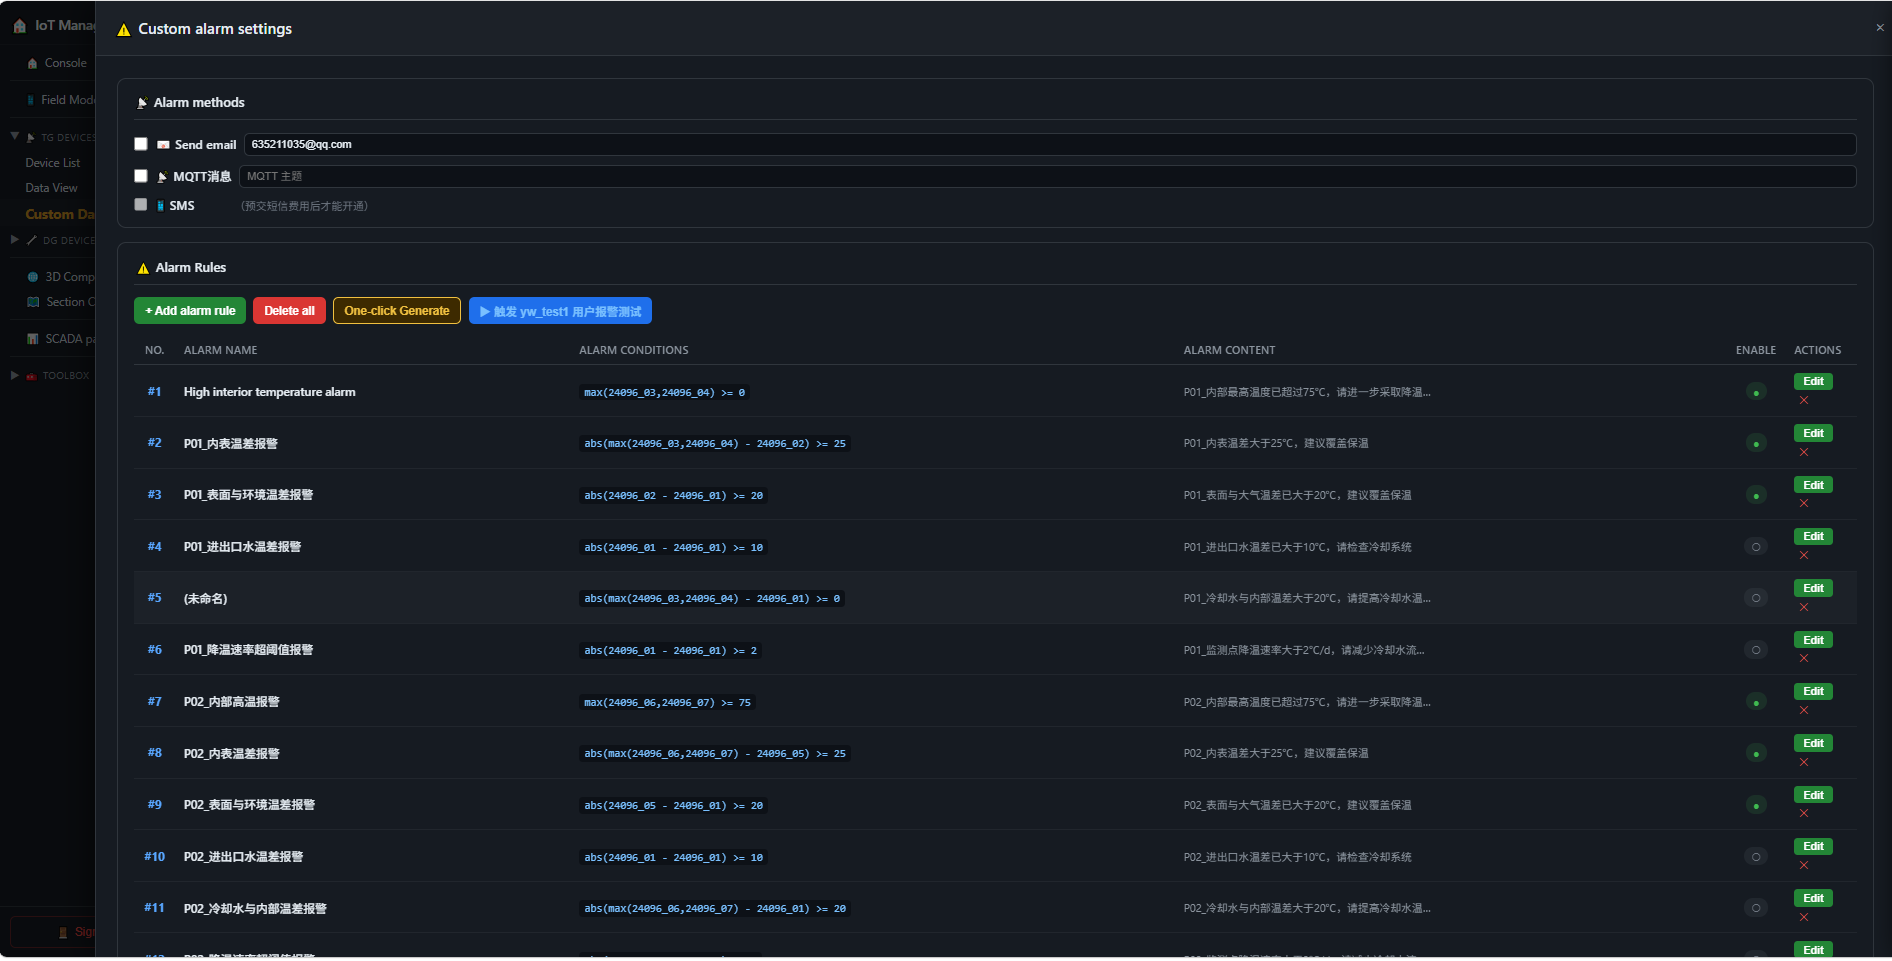
Alarm Rules
| Setting | Description |
|---|---|
| Enable / disable | Each rule can be toggled independently; the dashboard shows "Enabled N / Disabled M" |
| Rule name | e.g. "1# Pile Cap Overheat"; custom names supported |
| Condition | Threshold conditions (temp > high / < low), channel selection |
| Content | Notification text template, may include temperature, device name, time |
Push Channels
| Channel | Description | Setup |
|---|---|---|
| Send alarm emails to specified recipients | Enable email + set recipient(s) | |
| MQTT | Publish alarm messages to a topic for subscribers | Enable MQTT + set topic |
| SMS | Send SMS to a phone number (carrier channel required) | Enable SMS + set phone number |
Test & Logs
- Alarm test (
/api/custom-data/alarm/test): trigger one check immediately to verify rules and channels. - Alarm logs (
/api/custom-data/alarm/logs): review the last 100 check lines for your own rules.
11User API
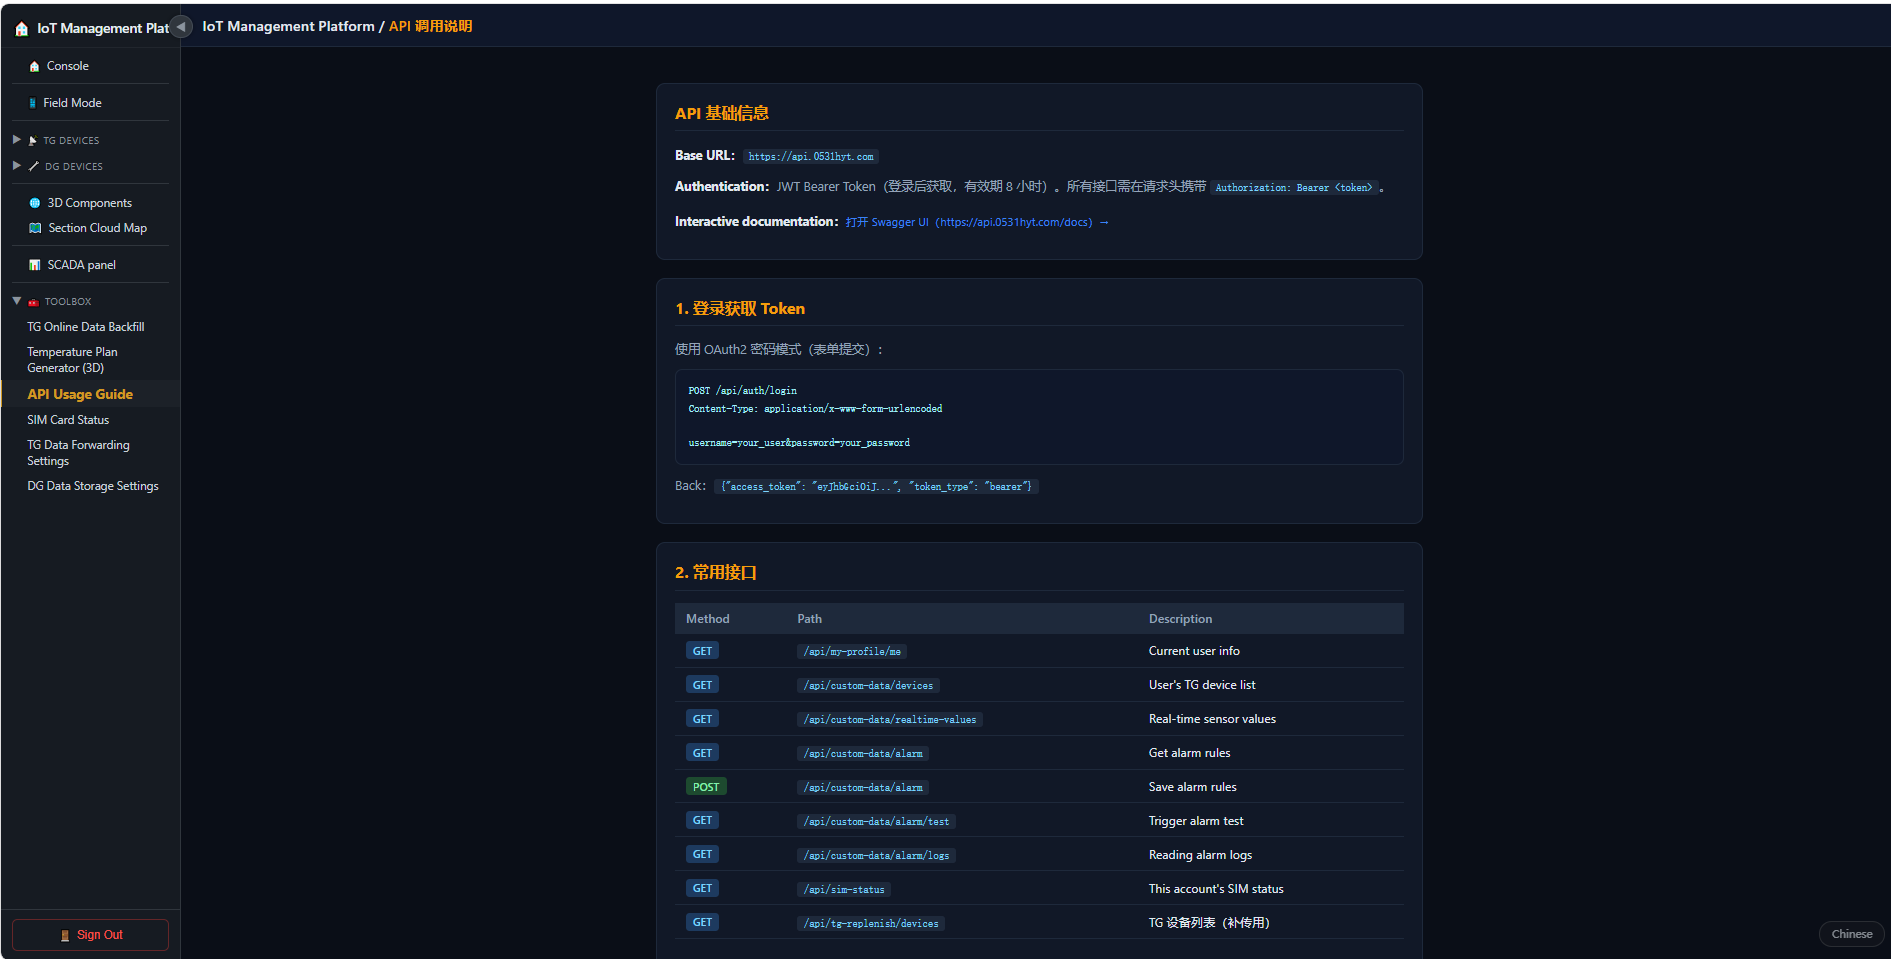
REST APIs (/toolbox/api-docs) enable third-party integration: device data queries, alarm rule management and SIM status.
Authentication
- JWT Bearer Token: call
POST /api/auth/loginto obtain a token (8-hour validity). - All endpoints require the header
Authorization: Bearer <token>.
Endpoints
| Method | Path | Description |
|---|---|---|
| POST | /api/auth/login | Login and obtain a token |
| GET | /api/my-profile/me | Current user info |
| GET | /api/custom-data/devices | User TG device list |
| GET | /api/custom-data/realtime-values | Real-time sensor values |
| GET | /api/custom-data/alarm | Get alarm rules |
| POST | /api/custom-data/alarm | Save alarm rules |
| GET | /api/custom-data/alarm/test | Trigger alarm check test |
| GET | /api/custom-data/alarm/logs | Read alarm judgment logs |
| GET | /api/sim-status | SIM card status for the user |
| GET | /api/tg-replenish/devices | TG device list (replenish) |
Python Example
# 1. Login to obtain a token
import requests
r = requests.post("https://api.0531hyt.com/api/auth/login",
    data={"username": "demo", "password": "demo"})
token = r.json()["access_token"]
headers = {"Authorization": "Bearer " + token}

# 2. Query real-time values with the token
r2 = requests.get("https://api.0531hyt.com/api/custom-data/realtime-values", headers=headers)
print(r2.json())
12SIM Card Status
The SIM status page (/toolbox/sim-status) queries SIM card status of your TG / DG devices online, helping you catch offline / out-of-credit risks early.
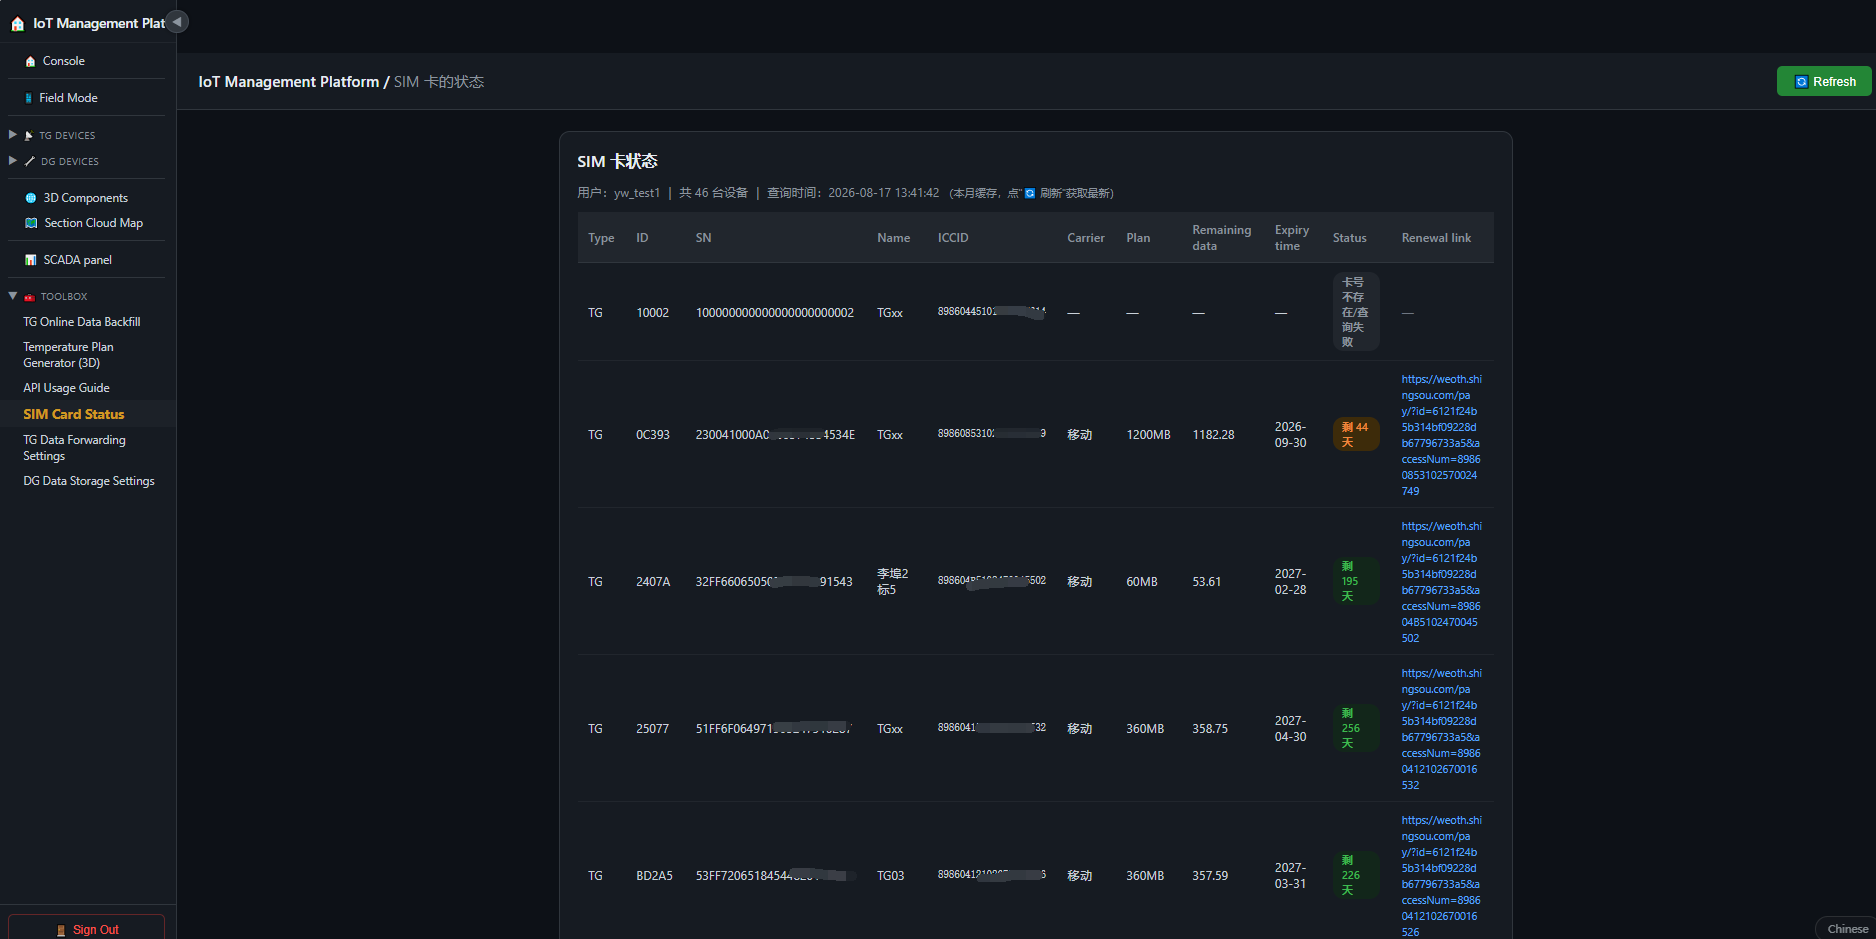
- Lists CCID, data usage and status per device.
- Shows the current month's cached result by default; click Force Refresh for the latest.
- Great for batch-checking project SIMs to distinguish "offline" from real device faults.
13Data Replenishment
Data replenishment (/toolbox/tg-replenish) covers data missing during communication interruptions: devices auto-upload after reconnecting, and manual replenishment tasks are also supported.
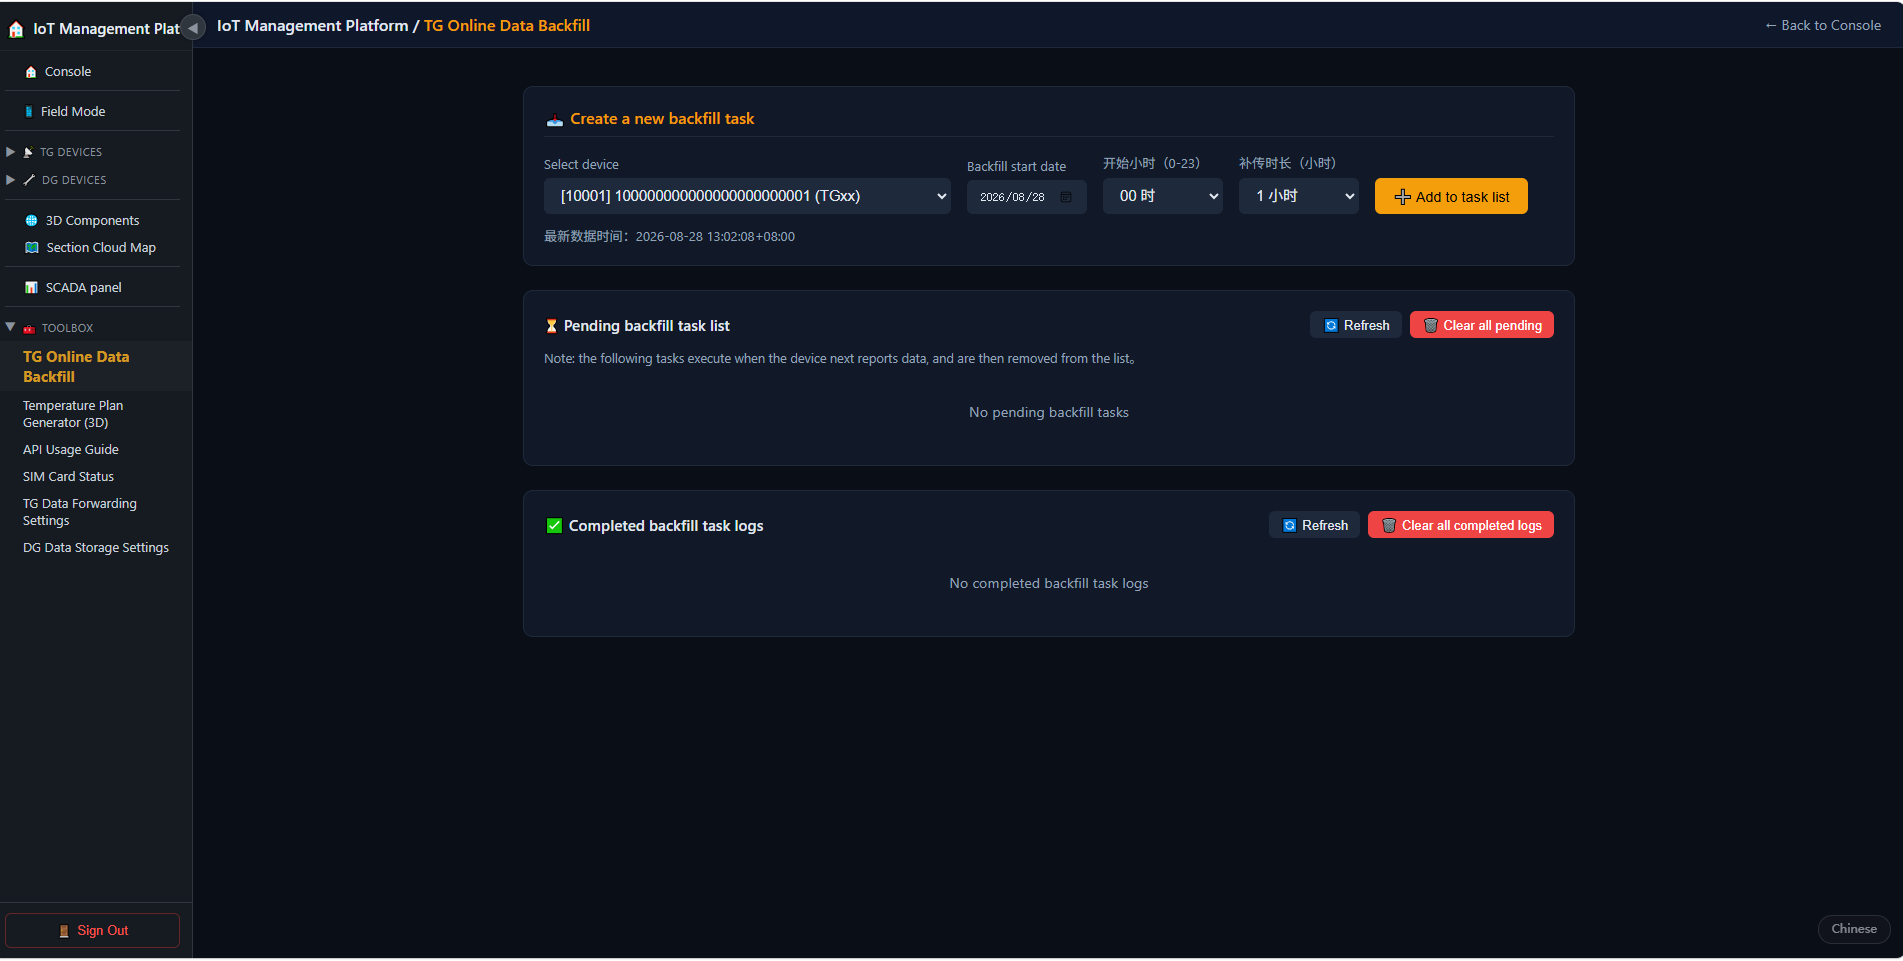
- Auto replenishment: data buffered during offline periods is uploaded once communication is restored.
- Manual tasks: create a task by selecting device and time range; the backend uploads data into storage.
- Task management: view progress, delete finished / failed tasks, batch cleanup.
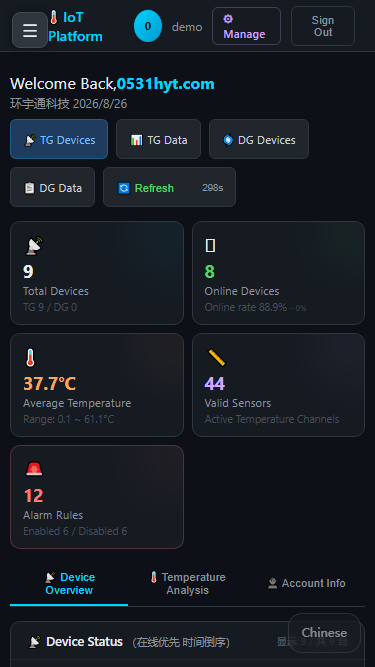
14Field Mode (Mobile)
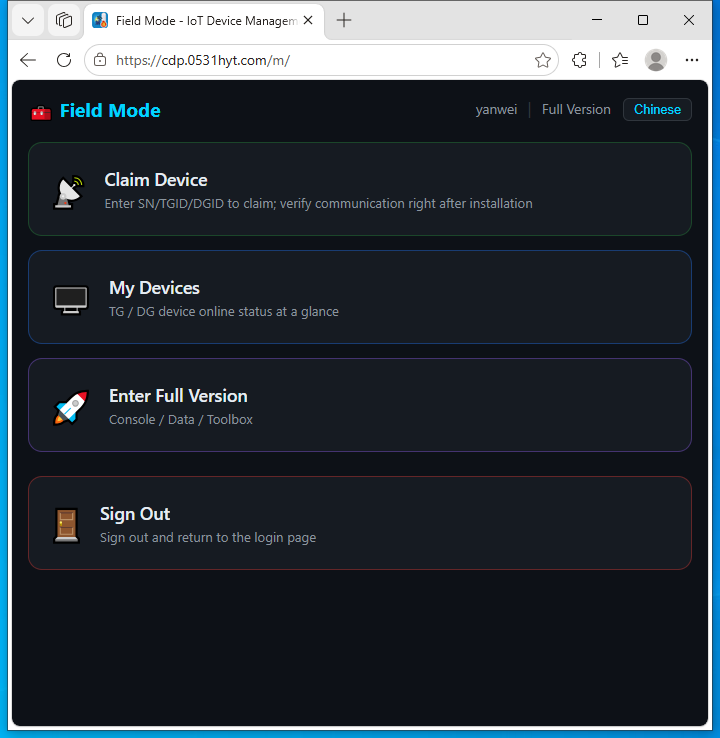
Field Mode (/m/) is designed for on-site staff and works directly in a mobile browser — no app installation. The UI switches automatically by screen width: <768px → Field Mode; ≥768px → full version.
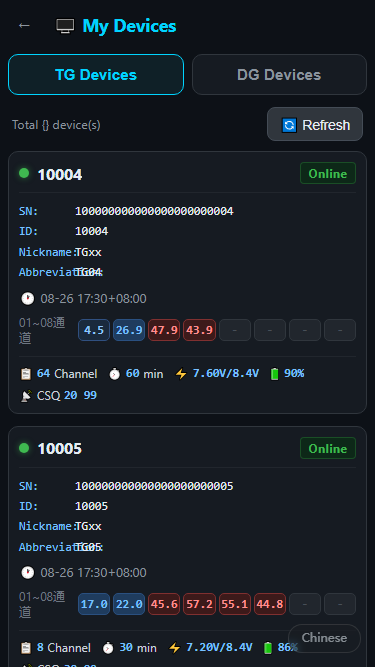
Field Mode Features
| Page | Function | Description |
|---|---|---|
/m/ Home | Overview + quick entries | Device overview, today's alarms |
/m/devices Devices | Temperatures by device | Card list; tap to view channel temps |
/m/claim Claim | Scan / enter SN | Claim new devices on site instantly |
15Admin Console
Administrators log in through a separate entry (/admin/login) to manage platform operations and the full device lifecycle.
| Page | Function |
|---|---|
/admin/users Users | Account list, role assignment (regular / viewer / admin), enable-disable, password reset |
/admin/tg-devices TG overview | All TG devices, ownership, online status, device info editing |
/admin/dg-devices DG overview | All DG devices and sub-device ownership |
/admin/dg-meas-support | DG sub-measurement support parameters |
/admin/dg-ctrl-support | DG sub-control command support |
/admin/dg-subdevice | DG sub-device binding management |
/admin/ownership-history Audit | Device ownership change history — who claimed / transferred a device and when |
16Bilingual Interface
The whole platform is available in Chinese / English, covering navigation, tables, chart legends, reports, pagination and tooltips (1,800+ terms).
How to Switch
- Floating button: a round button at the bottom-right toggles 中 / EN; your choice is remembered (localStorage).
- URL parameter: append
?lang=en(or?lang=zh) to open a specific language. - Auto translation: after switching, the page re-renders automatically — including JS-generated content (Chart.js legends, pagination).
?lang=en directly.17FAQ
Q1: A device shows offline. What now?
Check device power and network first (SIM status at /toolbox/sim-status); make sure the SN is claimed under your account; contact support if it persists.
Q2: Why can't I see other users' devices?
Ownership isolation: each account sees only its claimed devices. Contact an administrator if you need cross-device visibility.
Q3: Which fields do exported reports contain?
C5-9 reports follow the national standard: time, per-channel temperatures, average / difference values; fields can be customized in the report editor.
Q4: How do I debug a failed forwarding?
Check the response in /toolbox/tg-push-logs. Common causes: wrong endpoint URL, header auth failure, or the target service is not publicly reachable.
Q5: My token expired. What now?
Tokens are valid 8 hours. On 401, call /api/auth/login again to obtain a fresh token.
Q6: What URL do on-site phones use?
Open cdp.0531hyt.com in the mobile browser — Field Mode (/m/) activates automatically; or go straight to cdp.0531hyt.com/m/.
18More Chapters
This manual covers the software platform. For device hardware, wiring, on-site construction and network access, please refer to the corresponding manuals:
- Device Hardware: TG collector / DG gateway specifications, indicator lights, installation requirements.
- Wiring & Hardware: sensor wiring, collector daisy-chaining, power and lightning protection.
- On-site Construction: temperature hole layout, sensor embedding, cable routing and commissioning.
- Network Access: SIM activation, 4G signal requirements, VPN / whitelist integration.